Insight
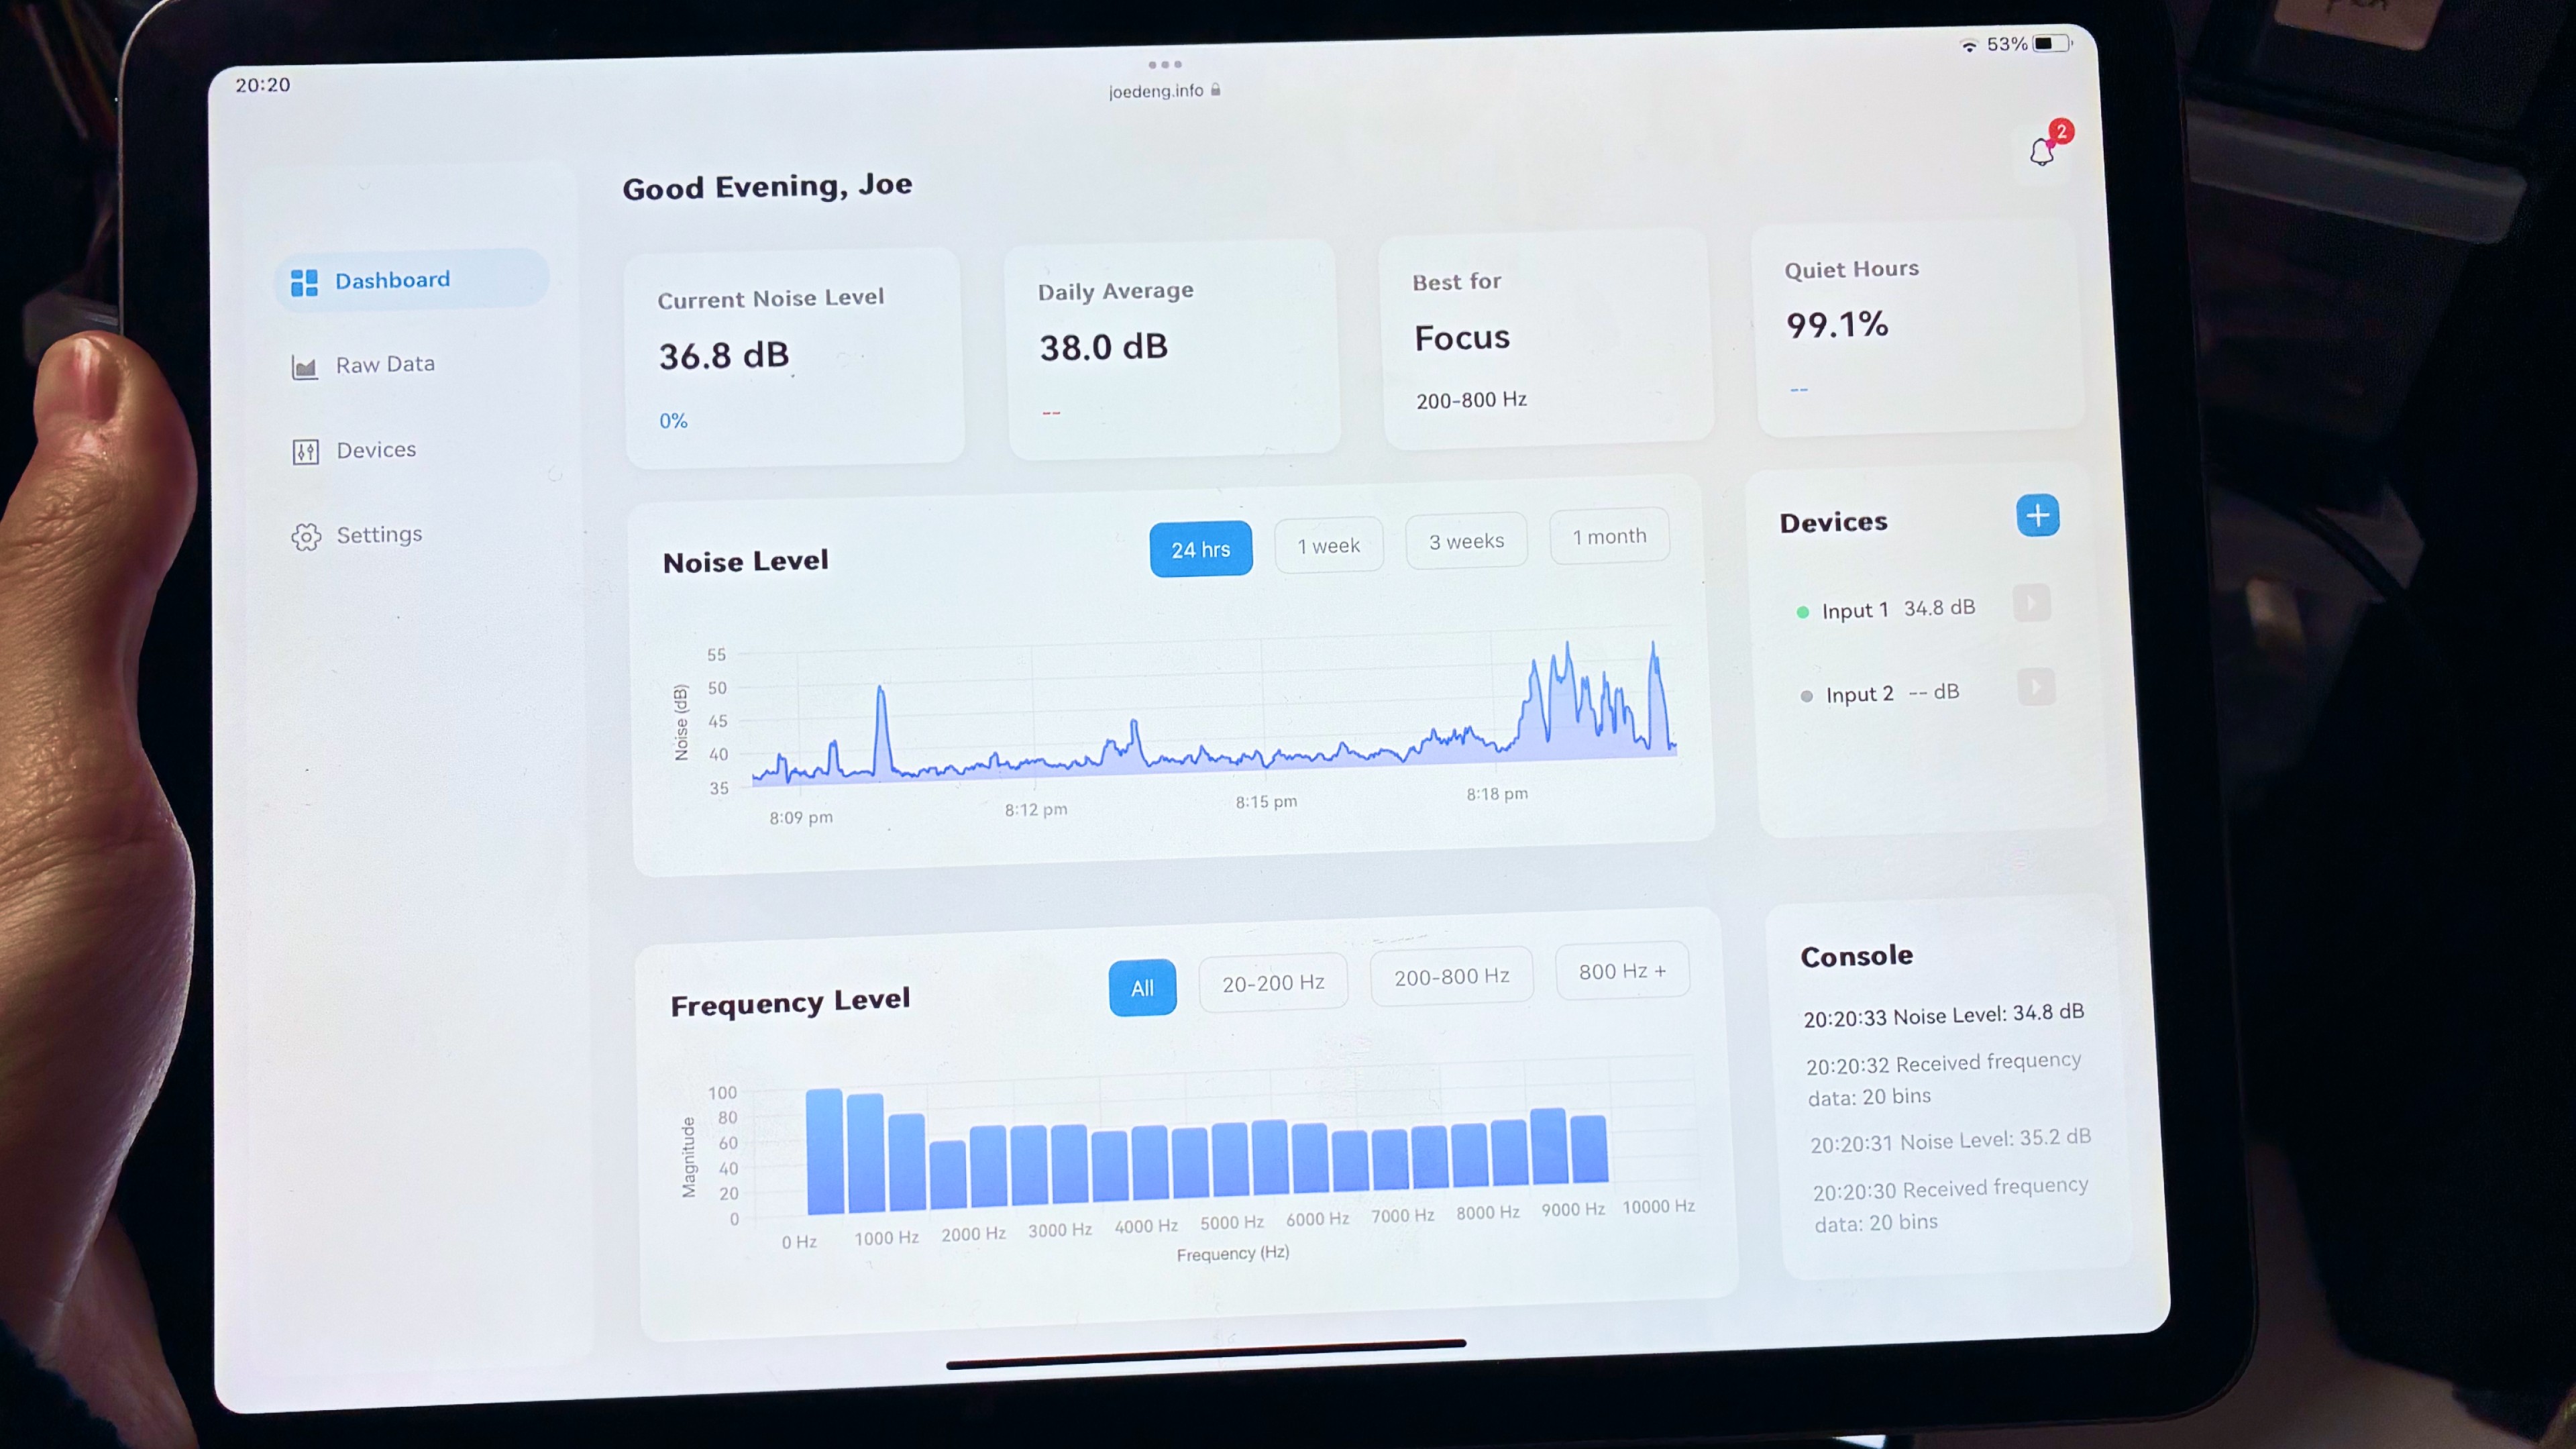
User testing revealed that abstract acoustic data becomes meaningful only when grounded in familiar concepts. Labels such as “focus,” “relax,” or “creative” helped users interpret sound levels emotionally rather than numerically. Participants also valued the ability to switch between time-domain and frequency-domain views, using each mode to reason about different activities or environments.
Trust in the system depended heavily on visibility of system state. Simple indicators for WiFi and MQTT connectivity significantly reduced anxiety and helped users understand whether the device was functioning correctly. Finally, limiting visual density and updating data at controlled intervals improved both readability and performance, reinforcing the value of calm technology principles.
Solution
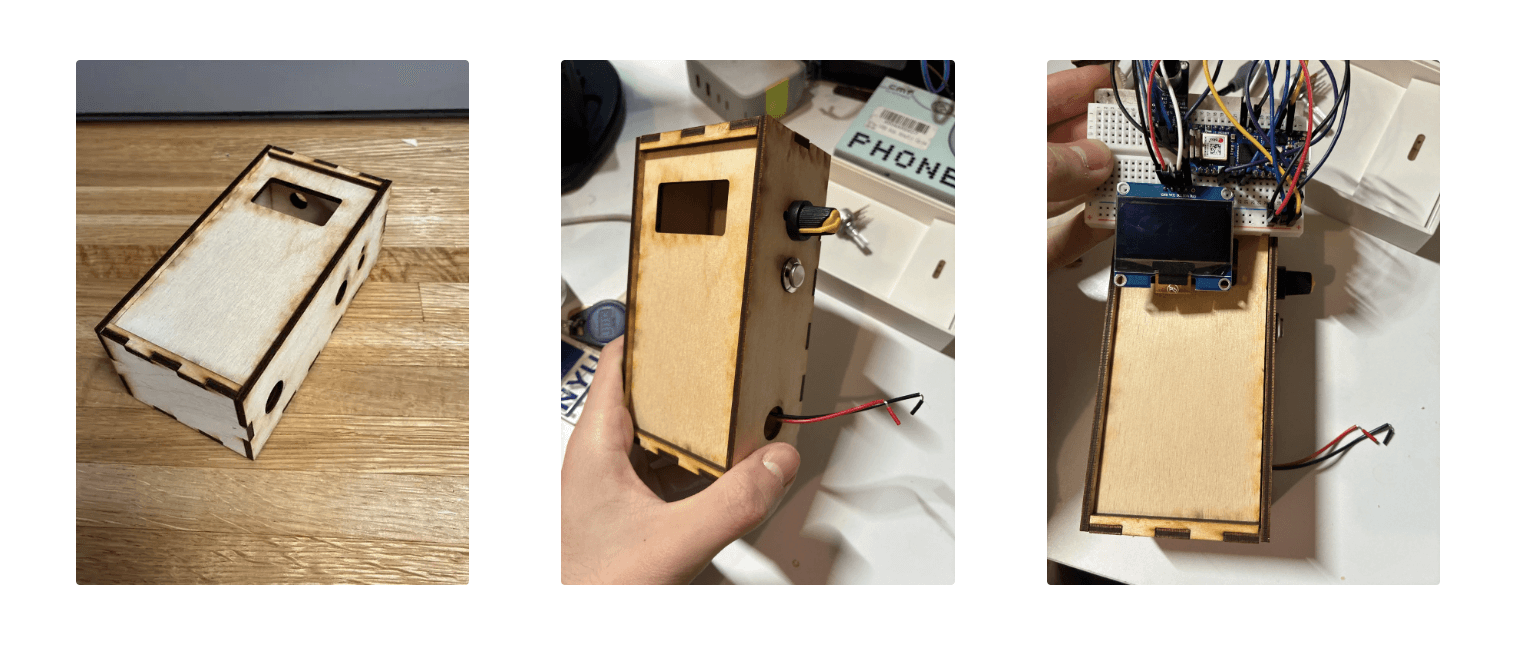
Layered Sensing Pipeline
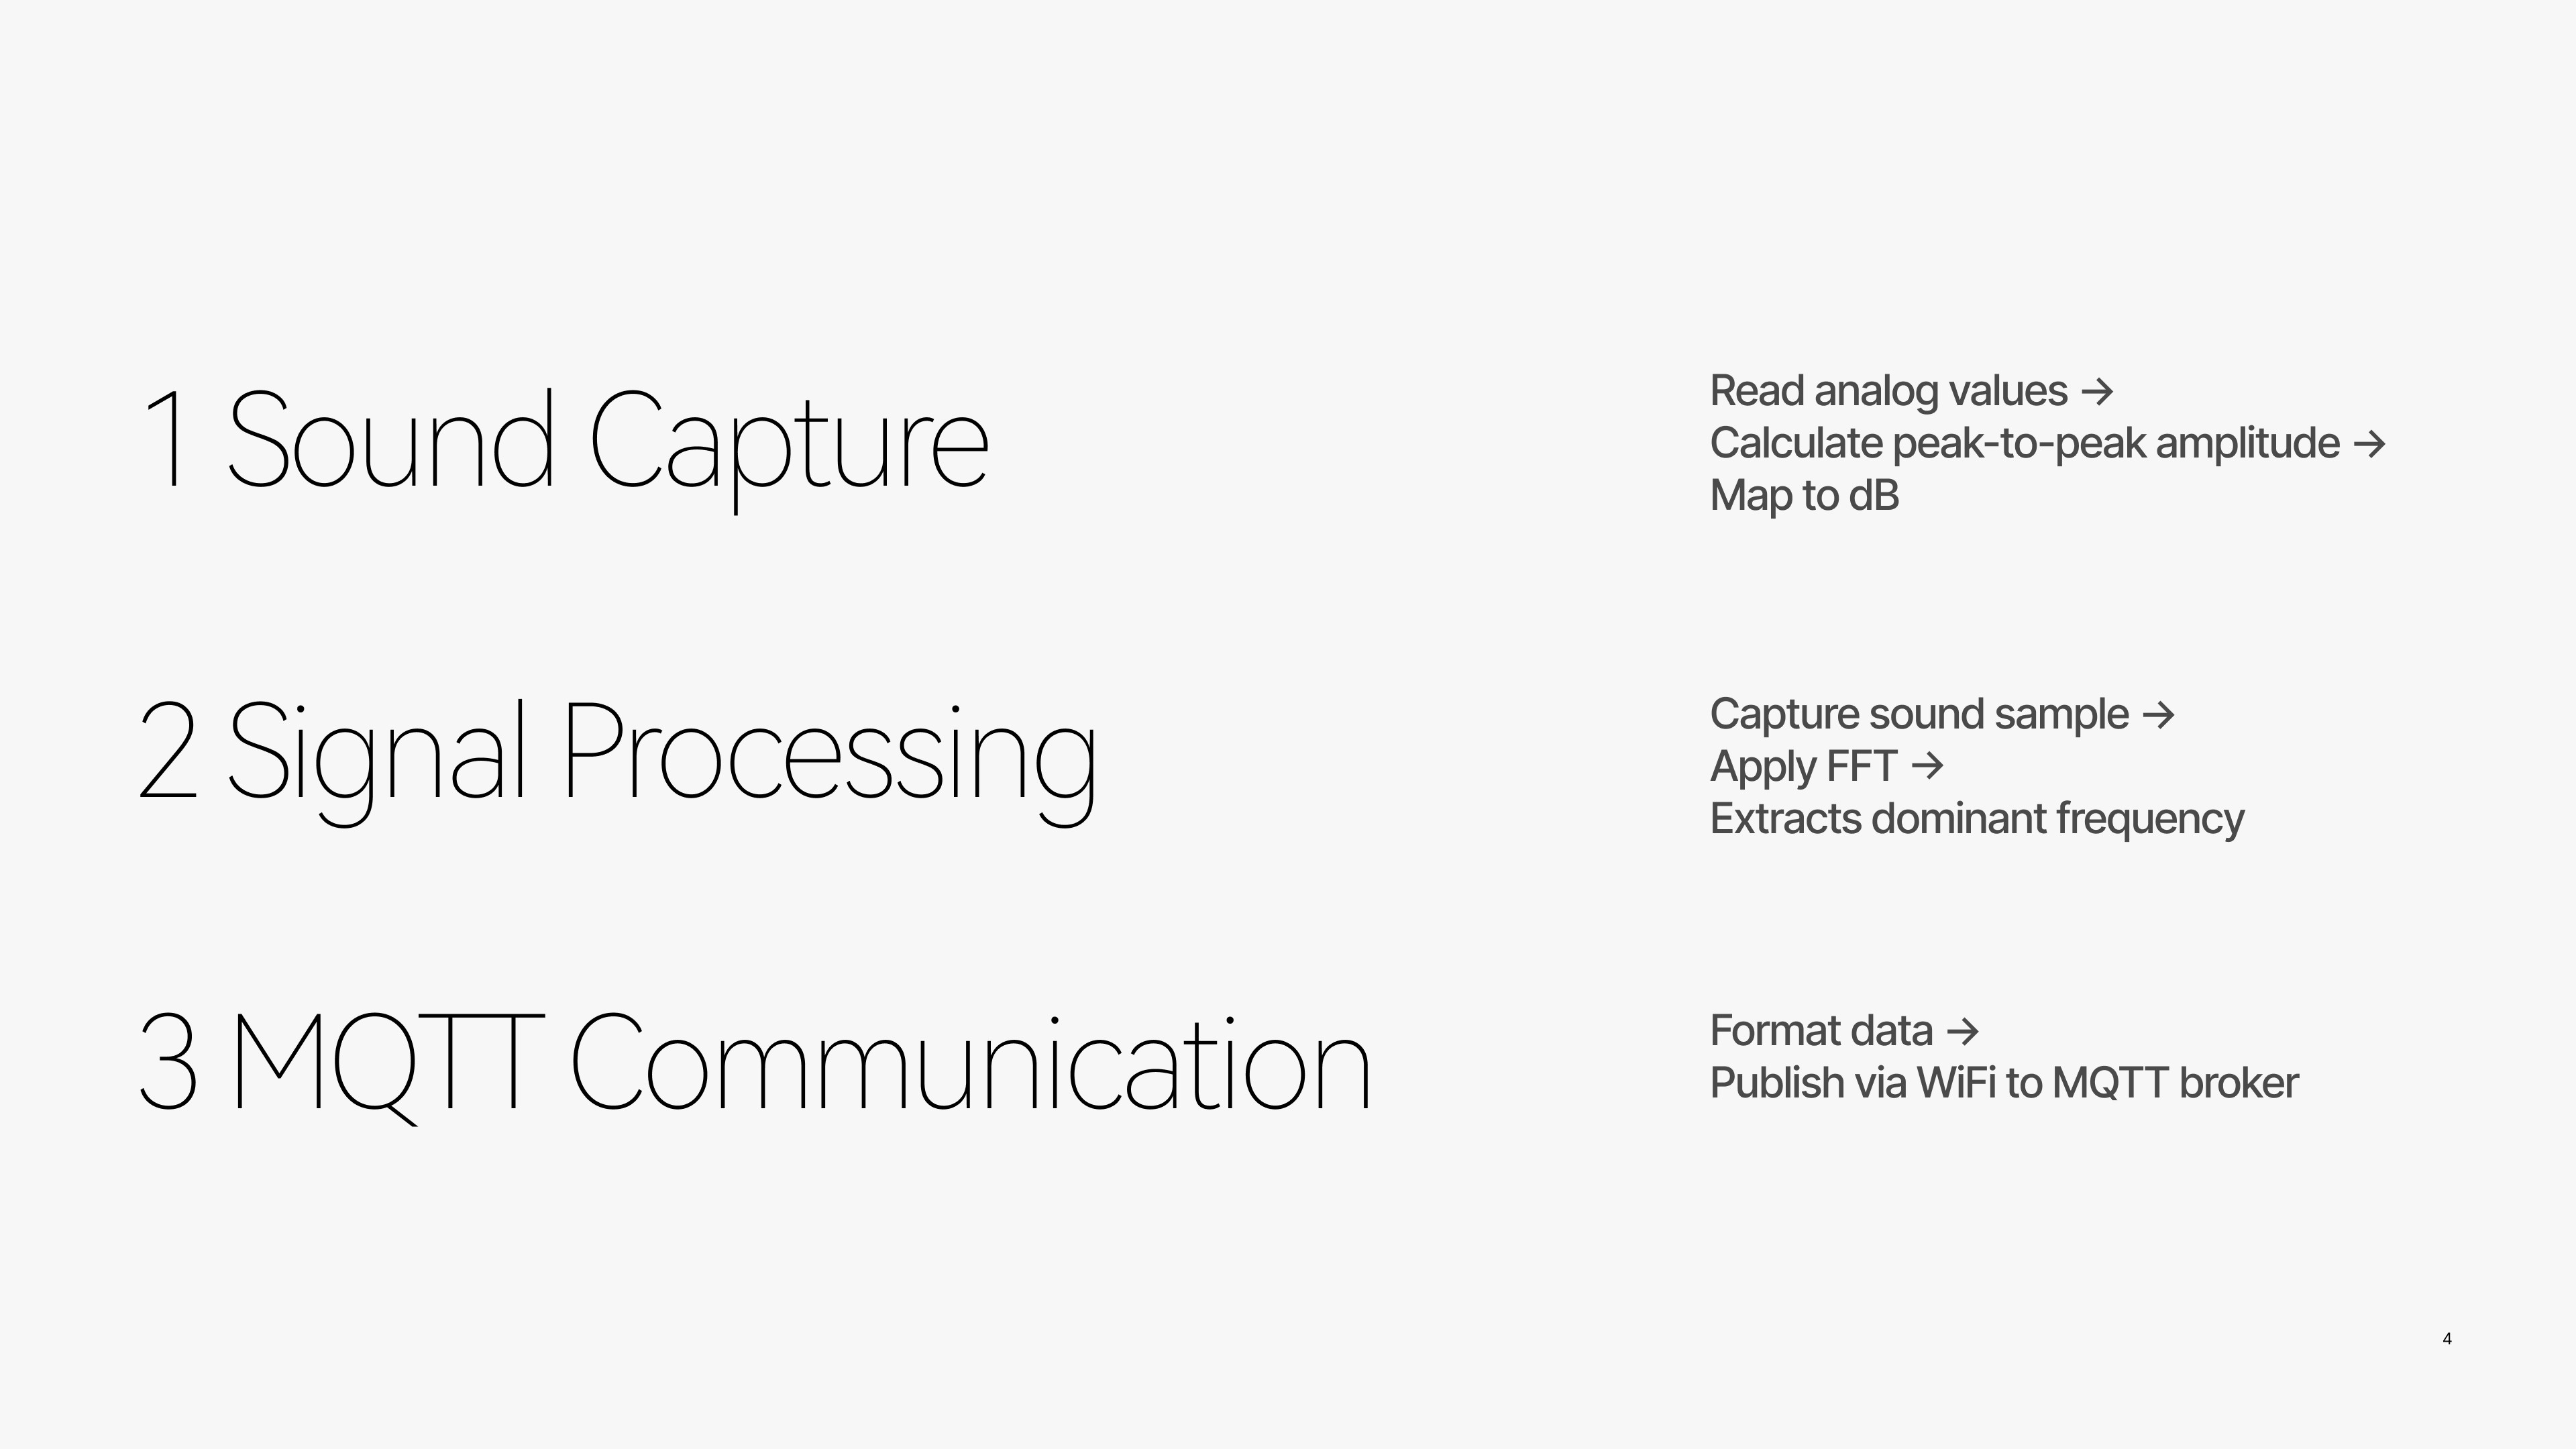
The system is structured as a layered pipeline that separates sound capture, signal processing, and visualization. Environmental audio is continuously sampled through a microphone module and processed on the microcontroller, where raw analog values are converted into sound pressure levels and frequency-domain data. Rather than pushing every fluctuation to the interface, the system deliberately filters and batches data, reducing noise both computationally and perceptually.
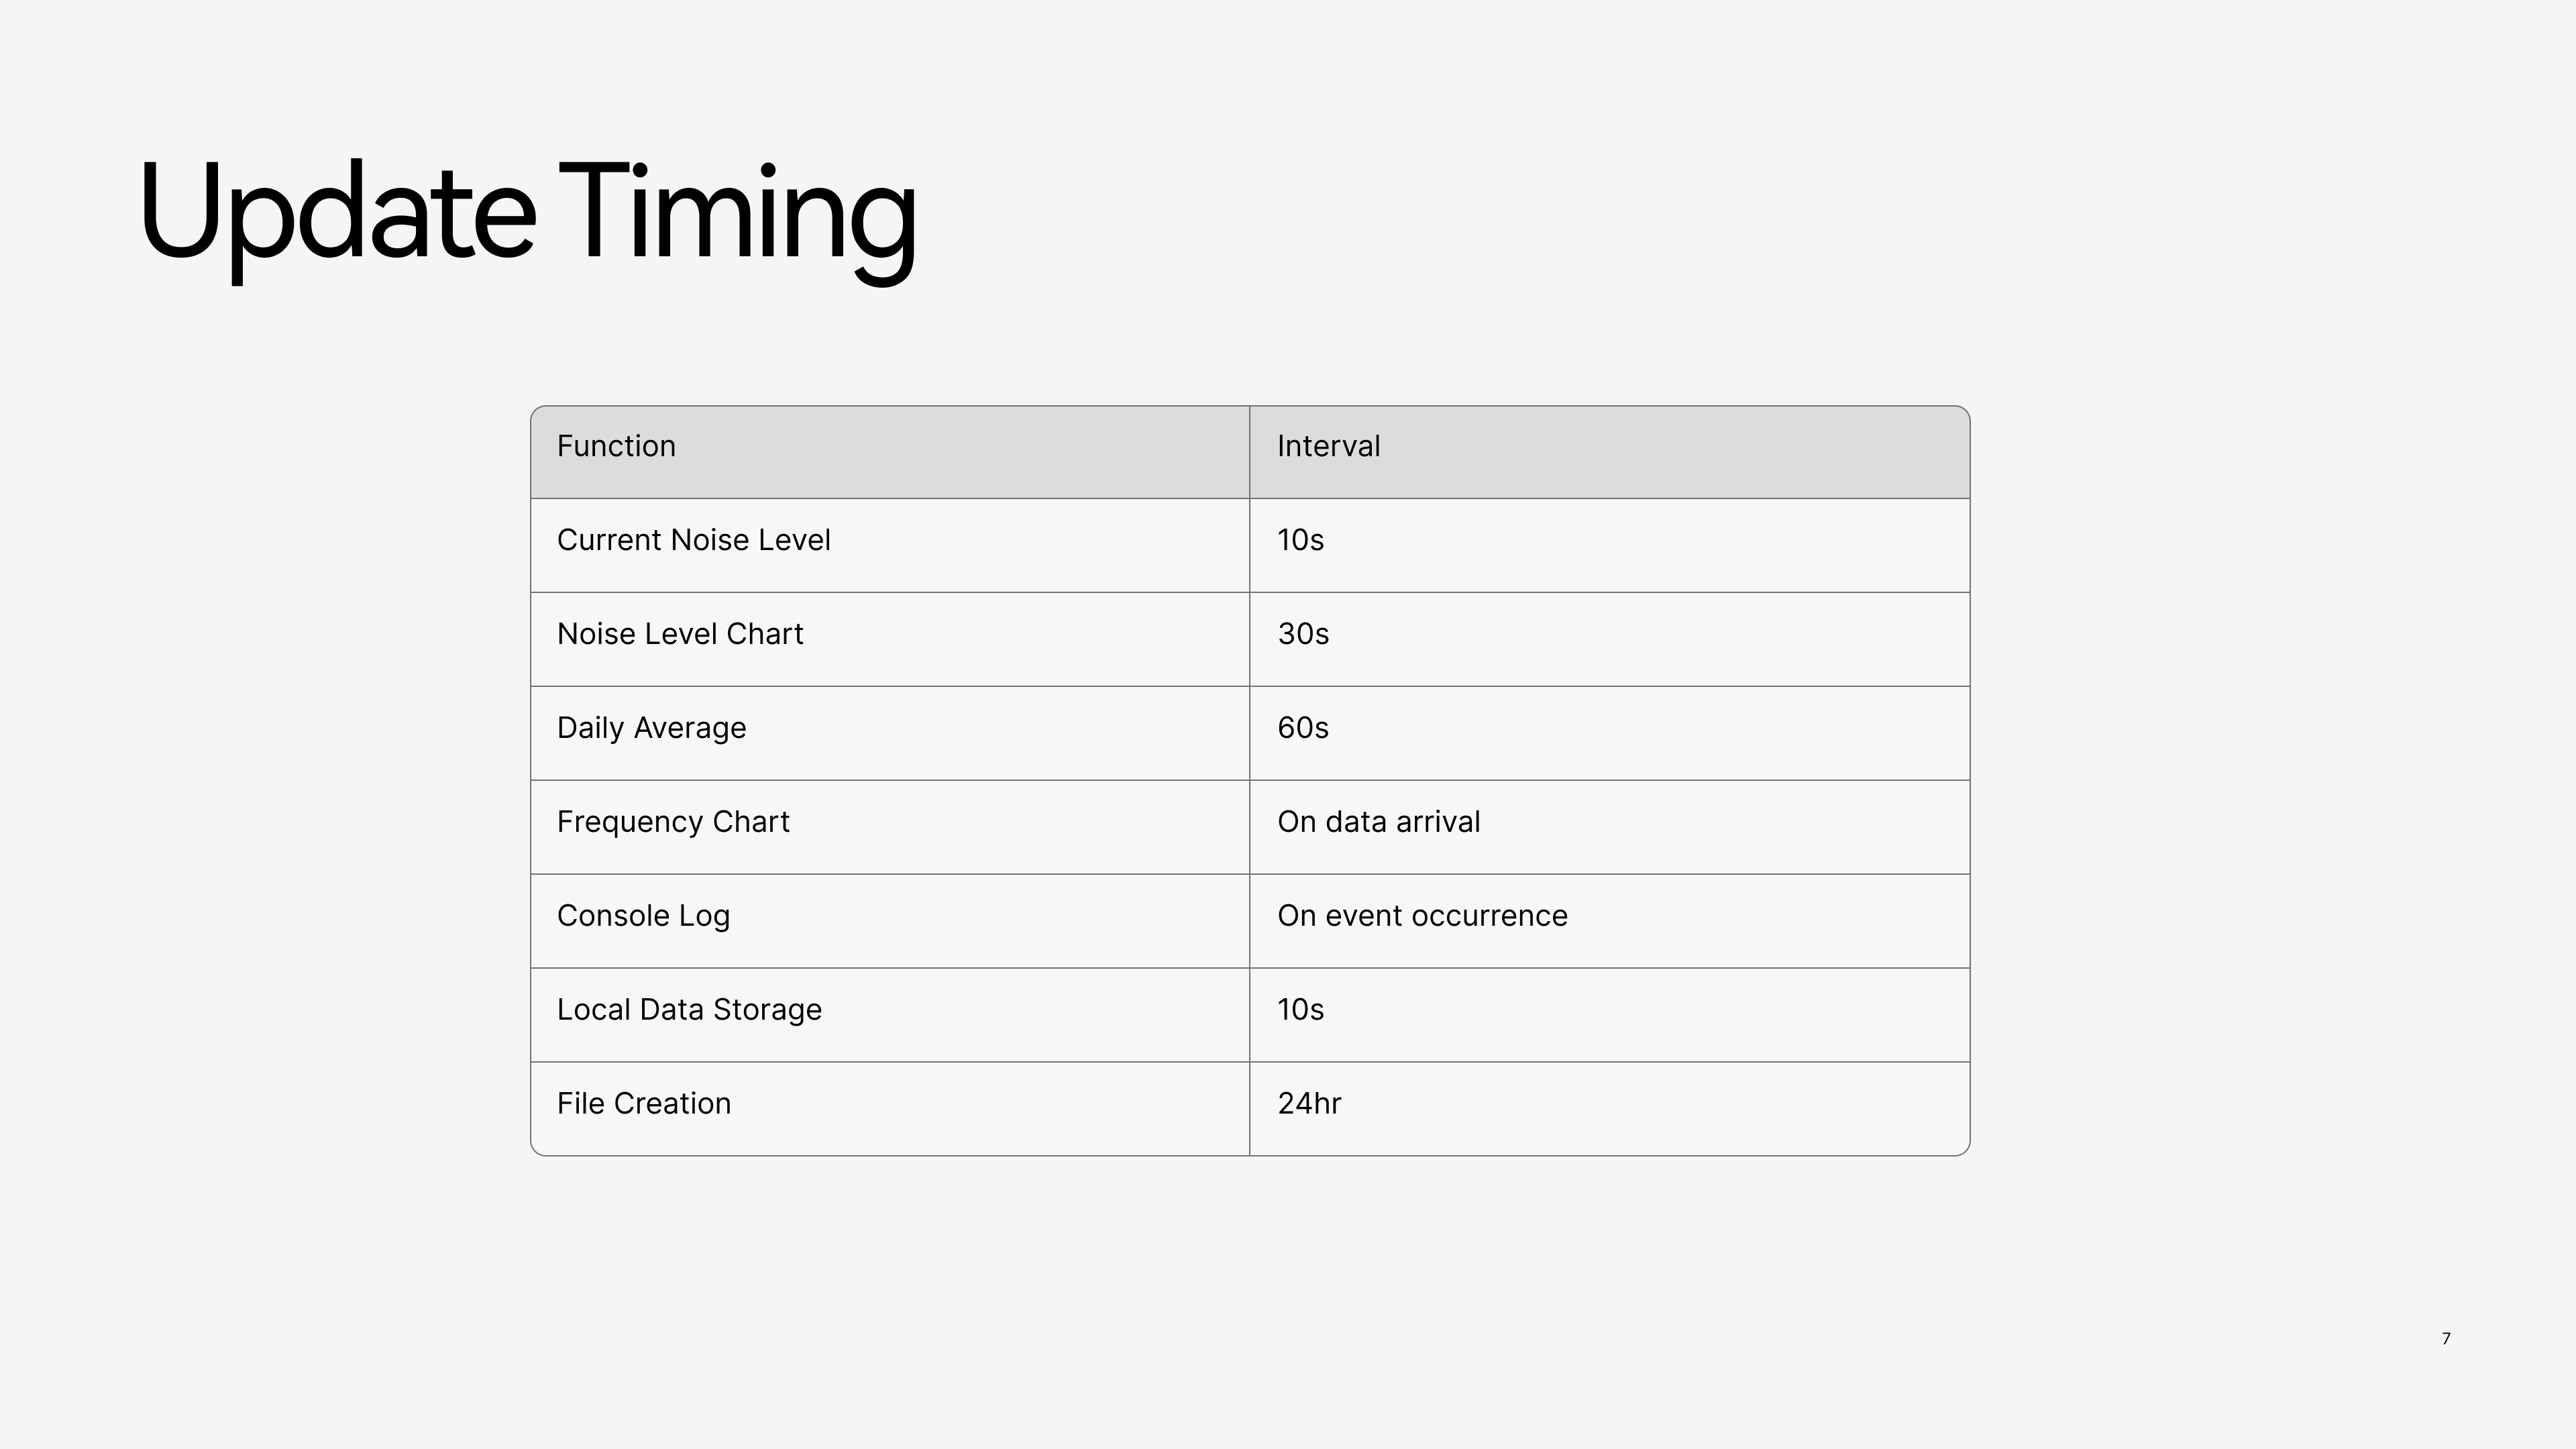
Temporal Control & Calm Updates
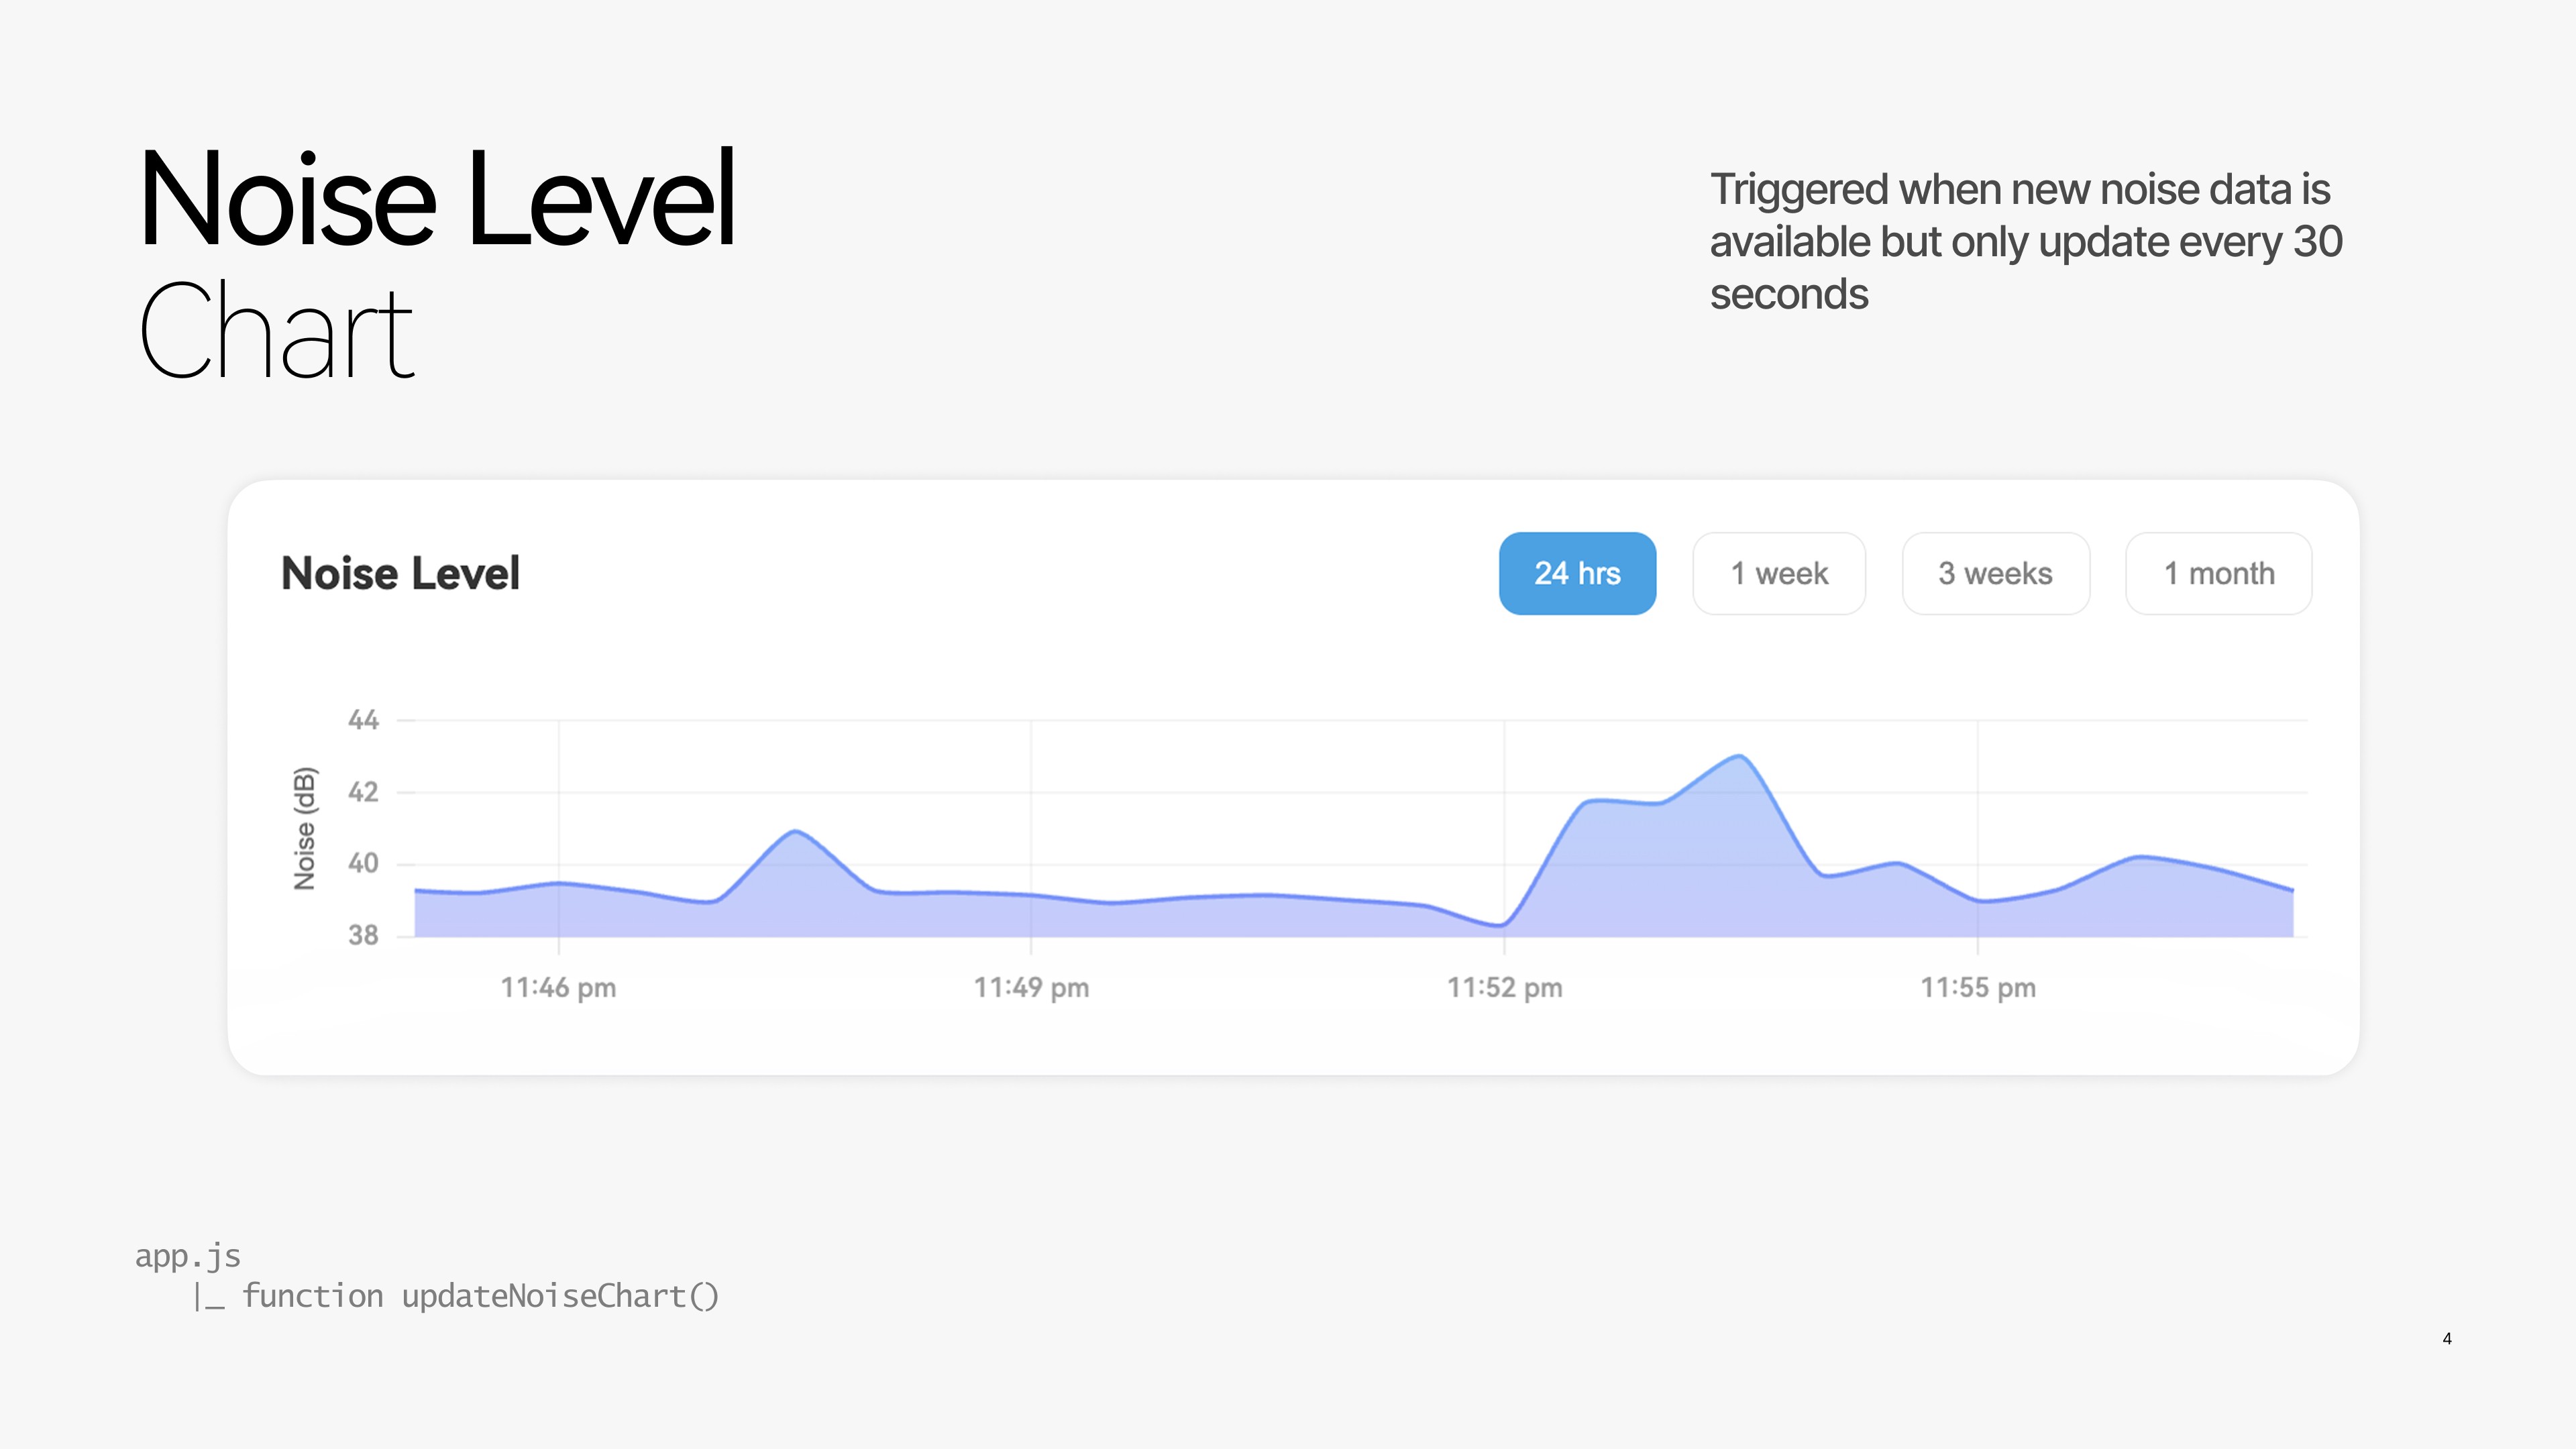
To support calm awareness, different types of information update at different rhythms. Current noise levels refresh at short intervals to provide glanceable feedback, while charts and daily averages update more slowly to emphasize patterns over spikes. This timing strategy prevents visual overload and aligns with how users naturally interpret environmental change.
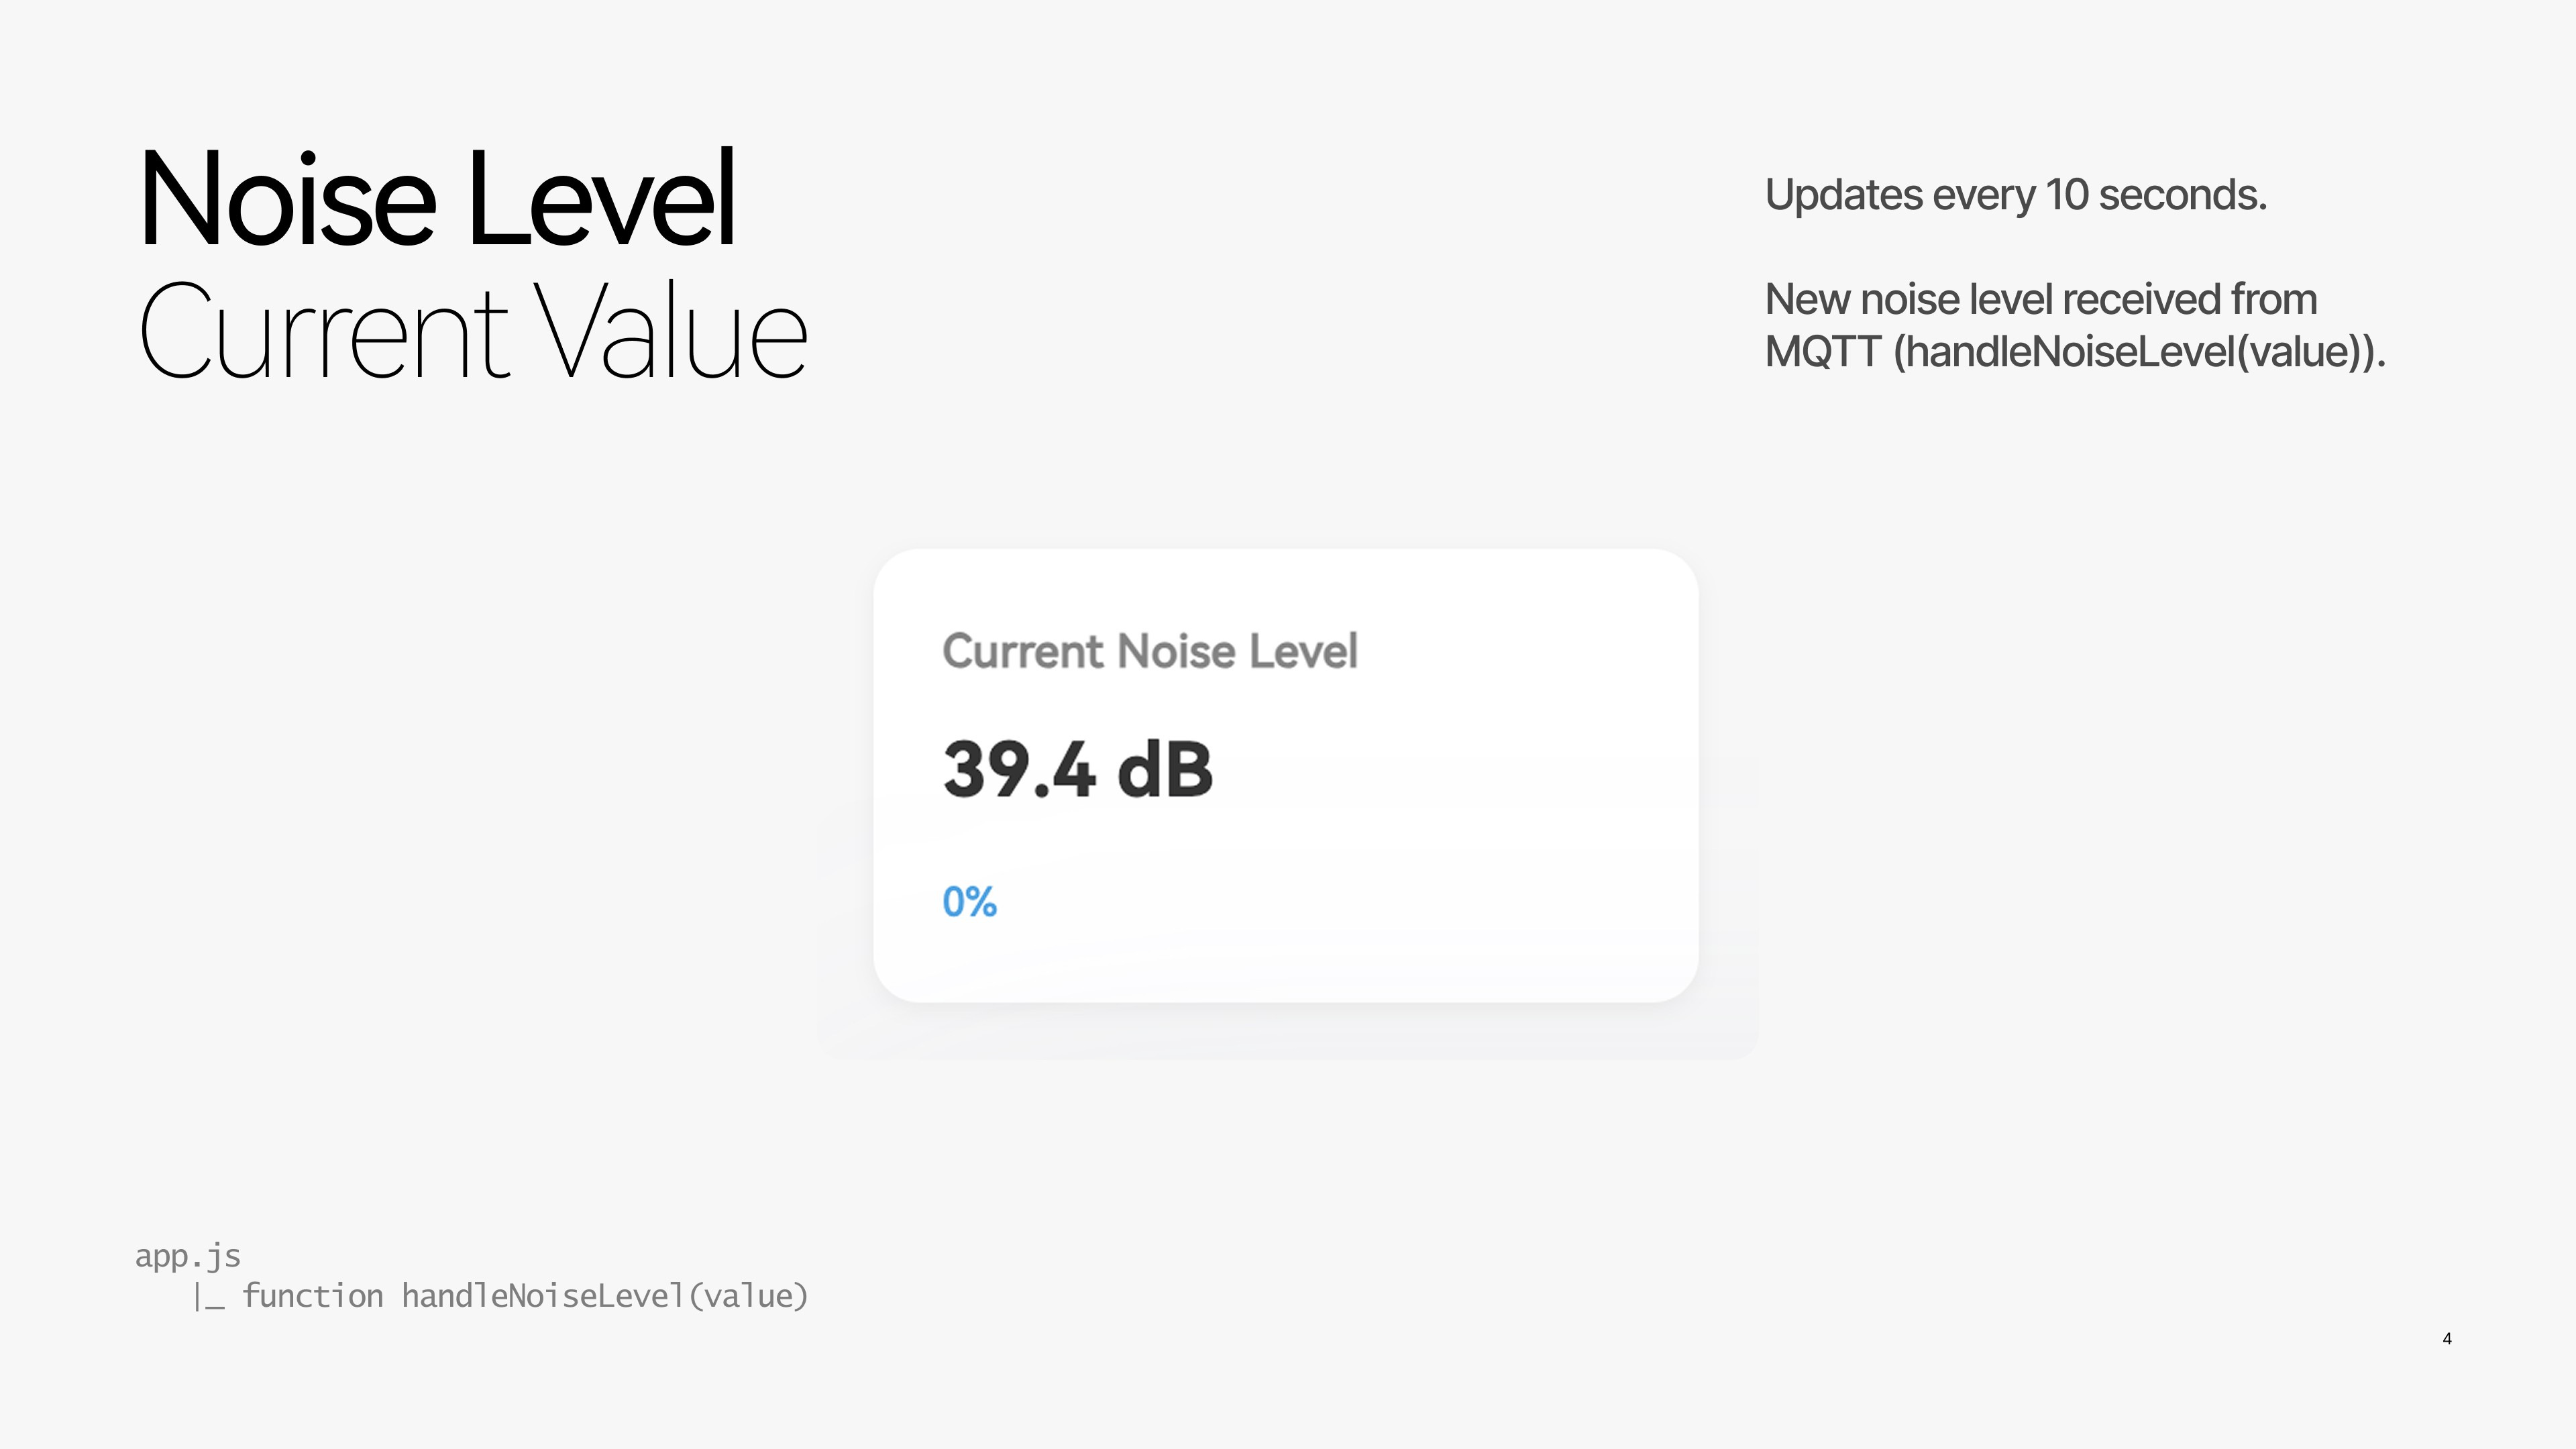
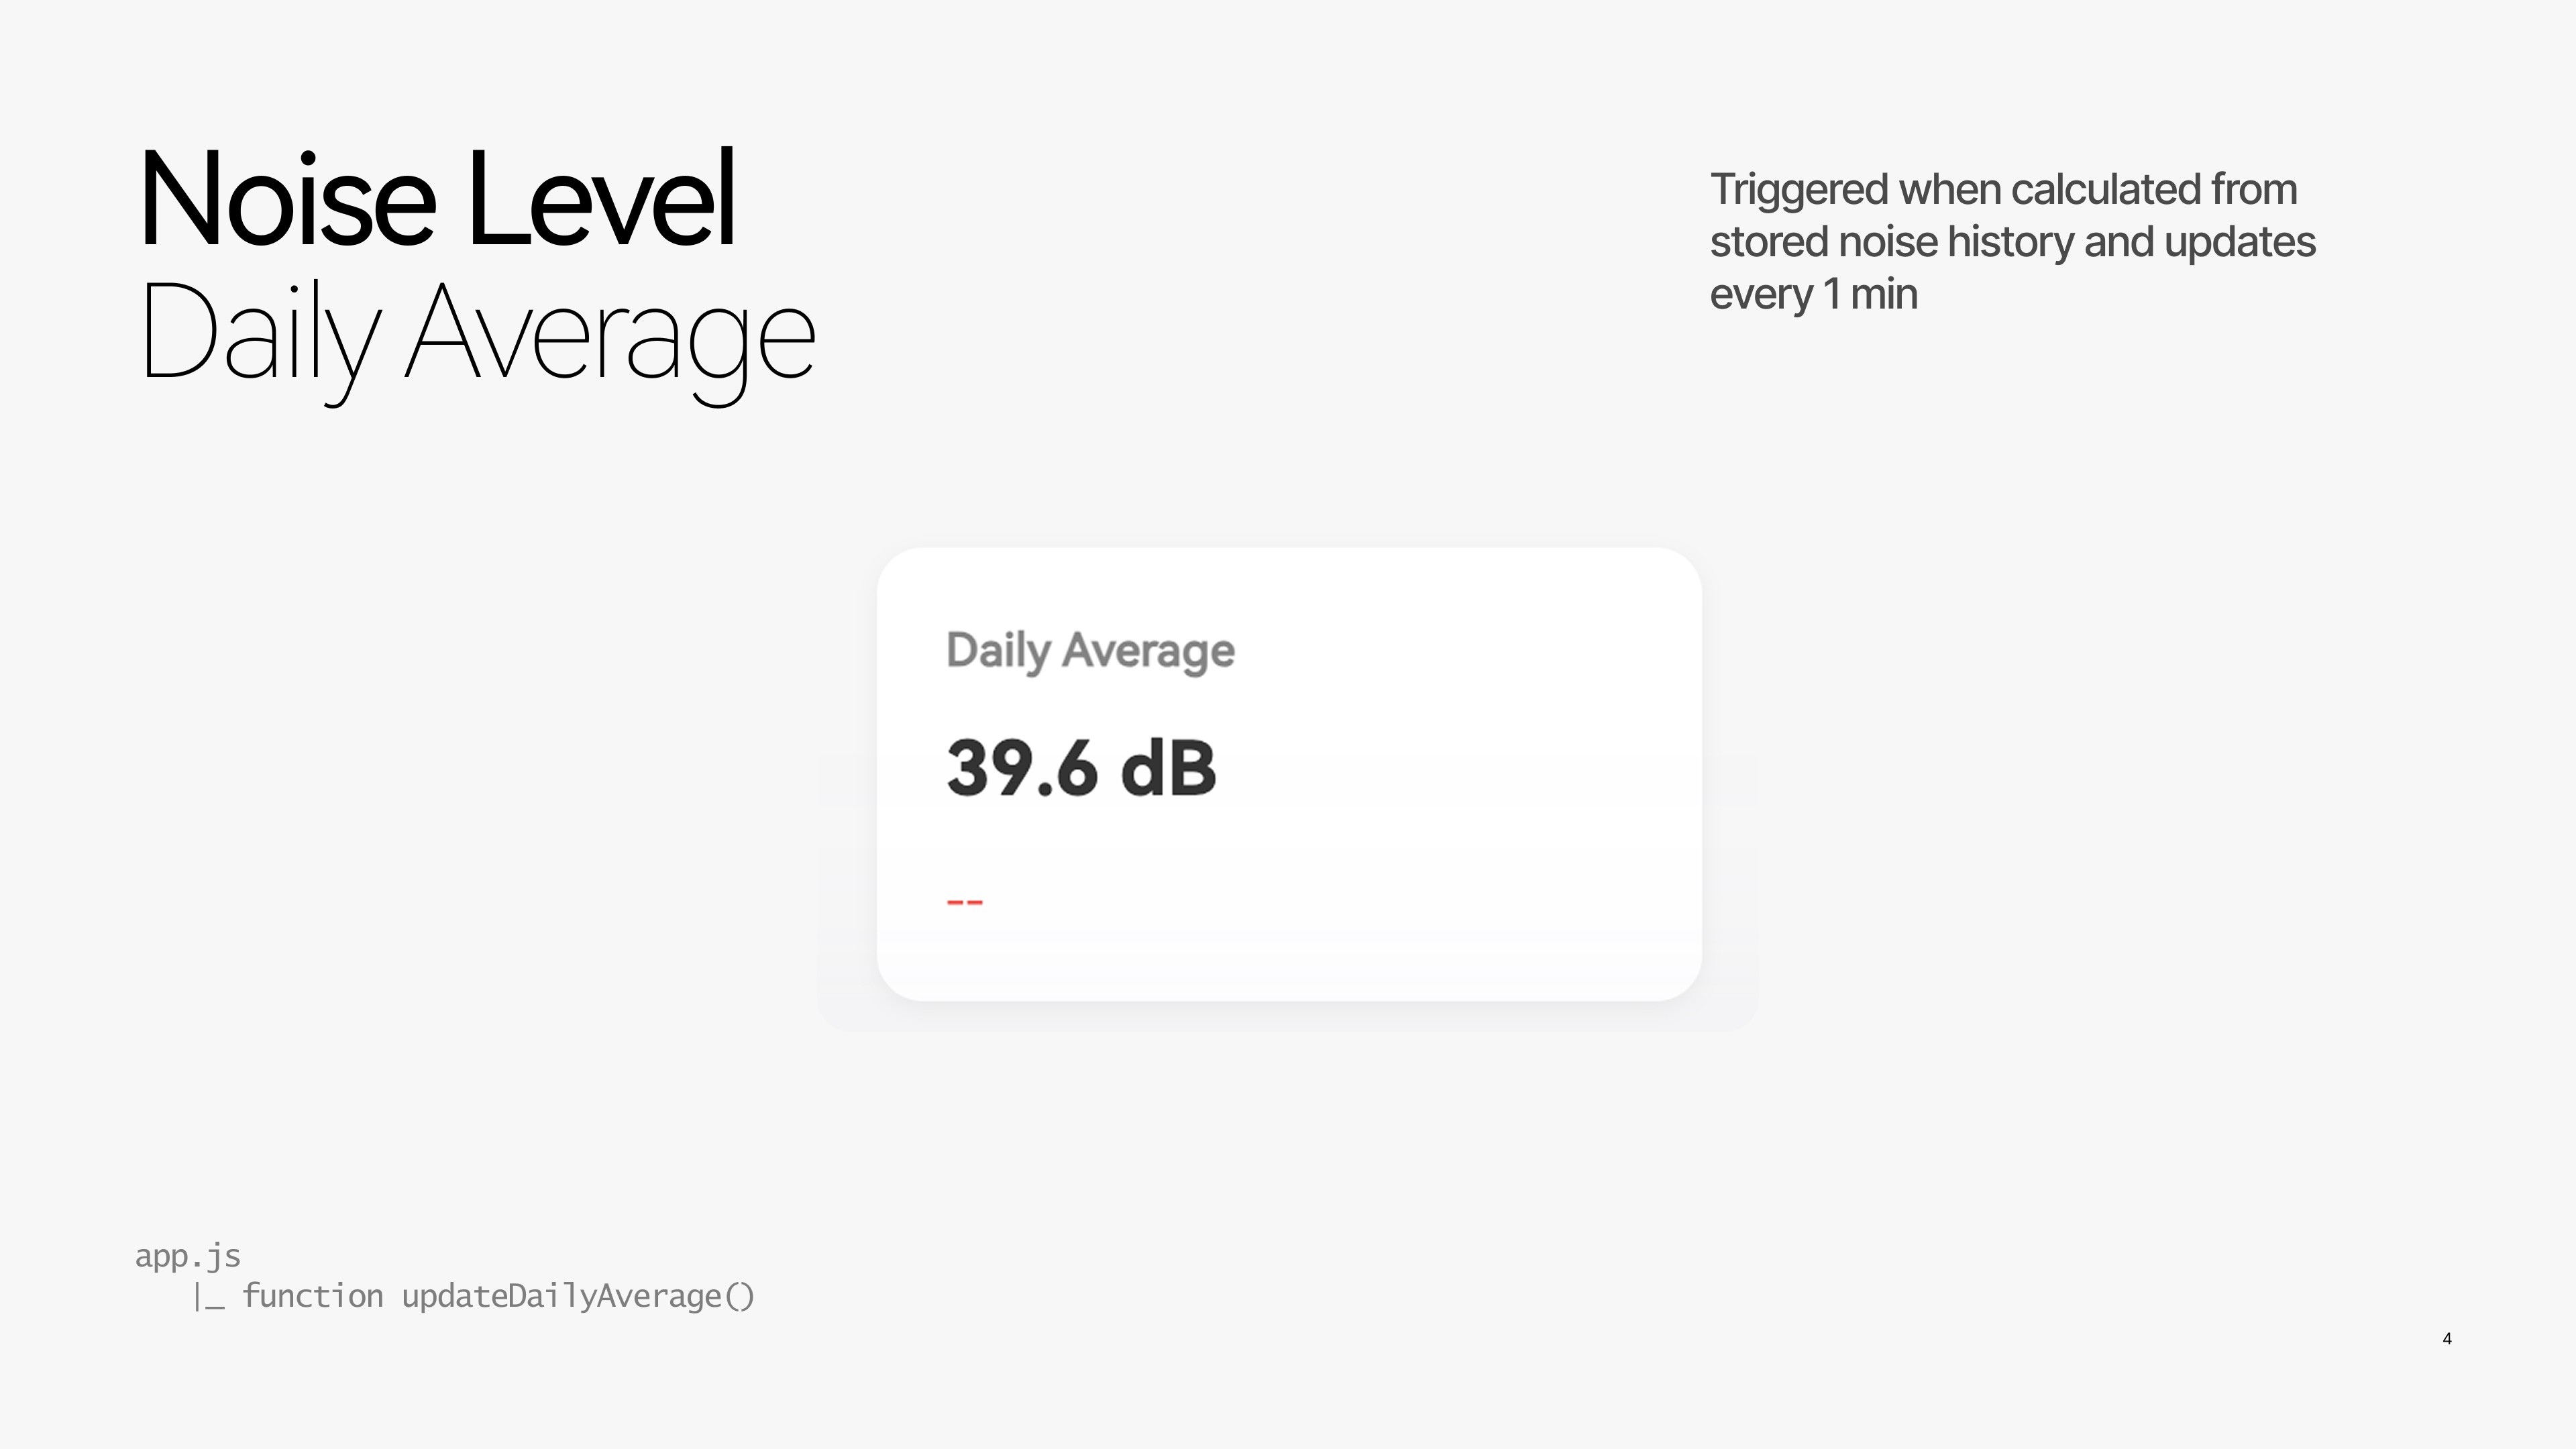
Multi-Resolution Sound Visualization
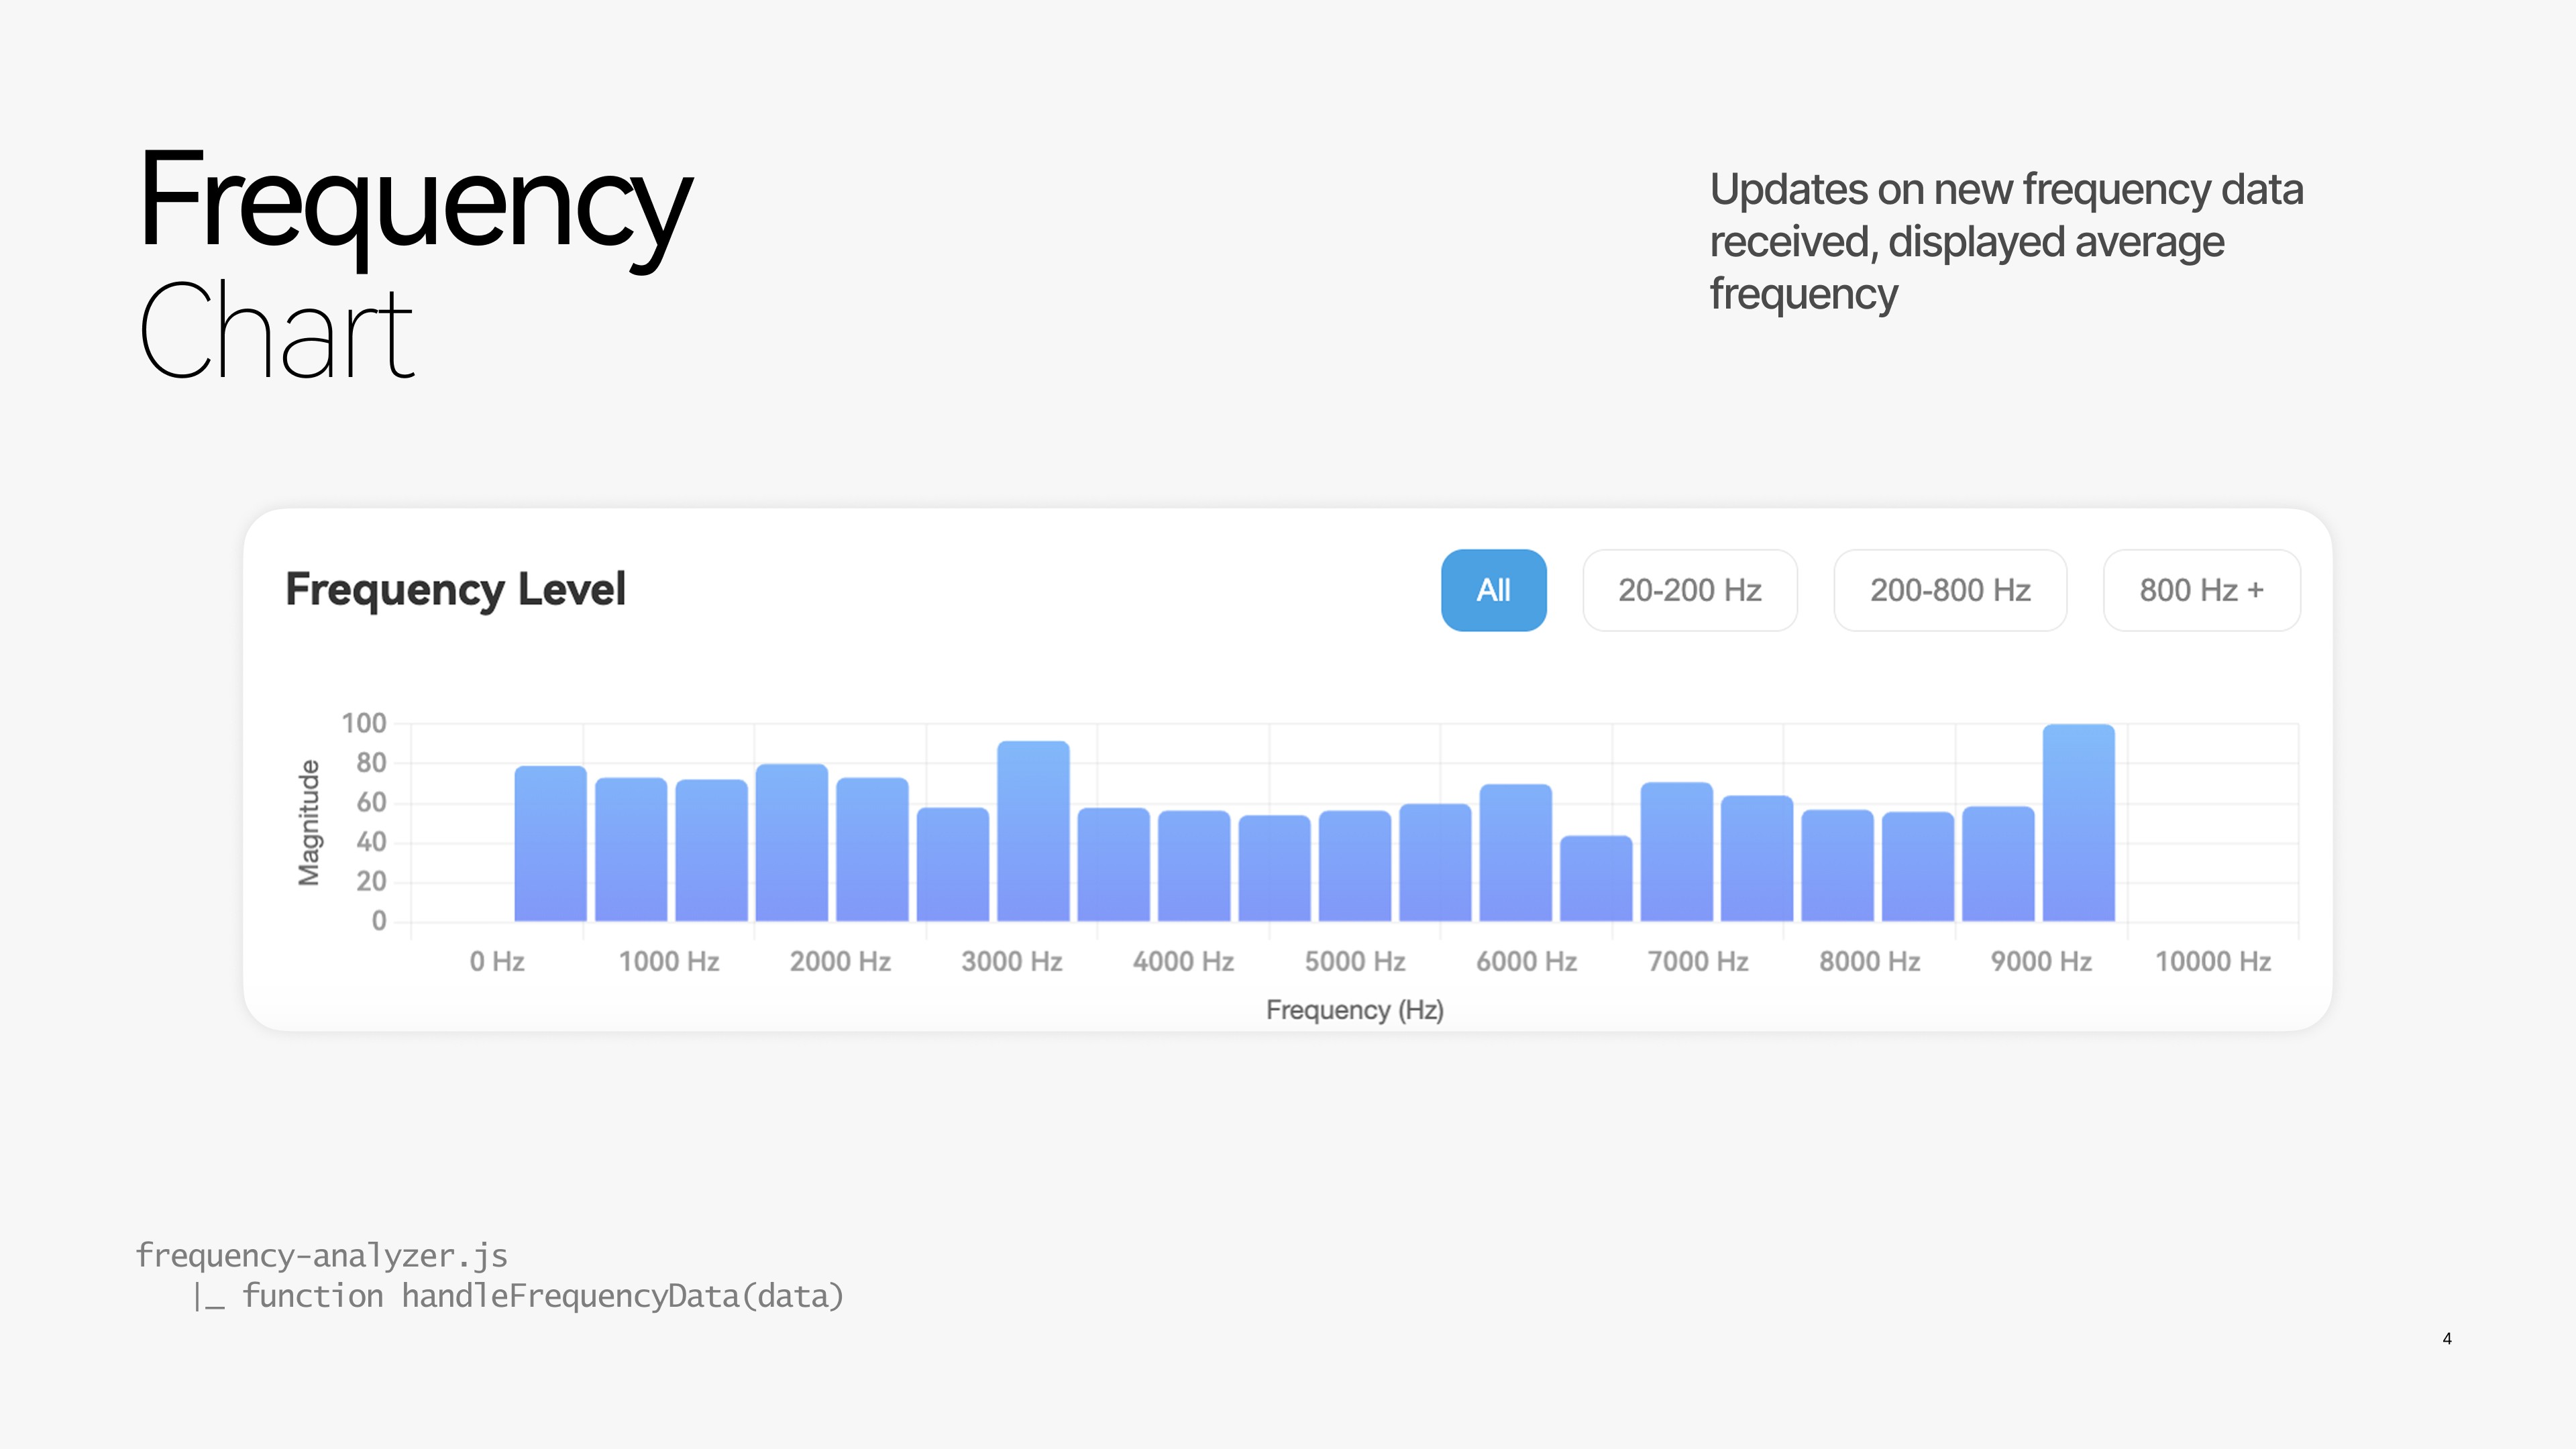
Noise data is presented at multiple levels of abstraction. A single-value noise indicator offers immediate context, while time-series charts reveal longer-term trends. Frequency data is visualized as a secondary layer, updated only when new spectral information arrives, allowing users to explore the acoustic character of a space without forcing continuous attention.
Transparent System Feedback
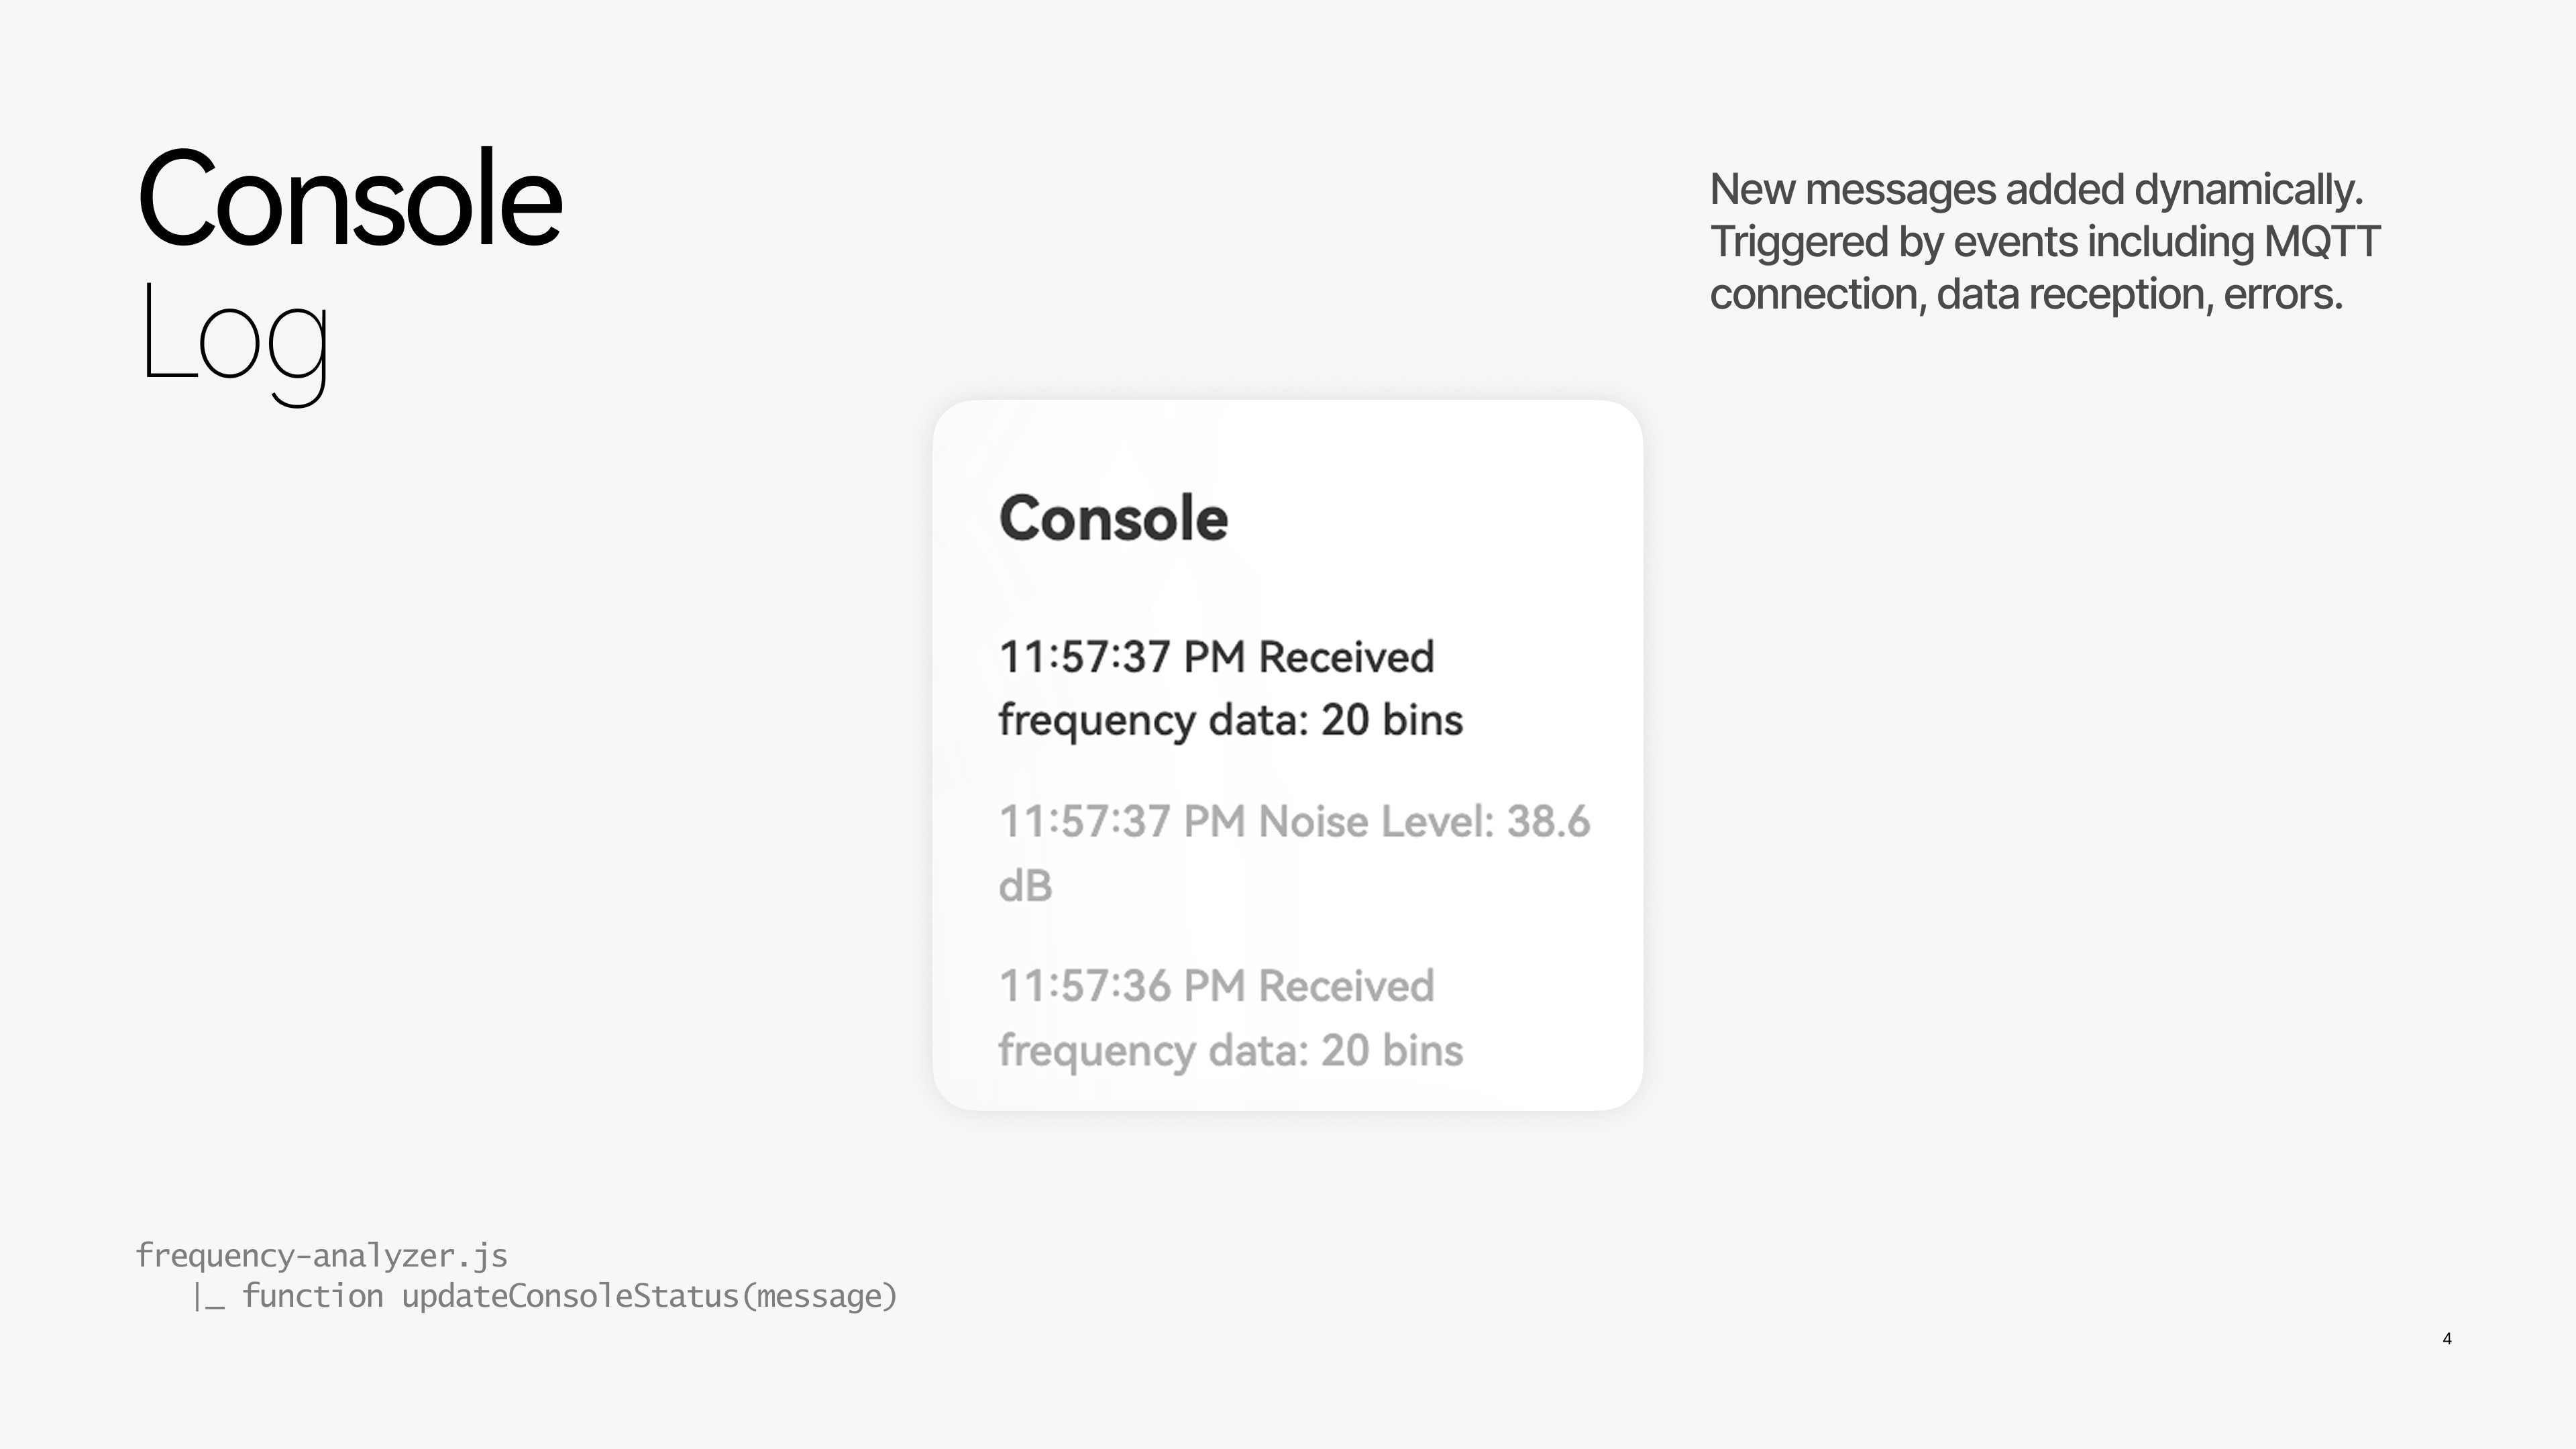
System status is treated as part of the interaction design rather than a hidden technical layer. Lightweight indicators and a console log surface key events such as MQTT connectivity, data reception, and errors. This transparency reduces user uncertainty and builds trust without relying on disruptive alerts.
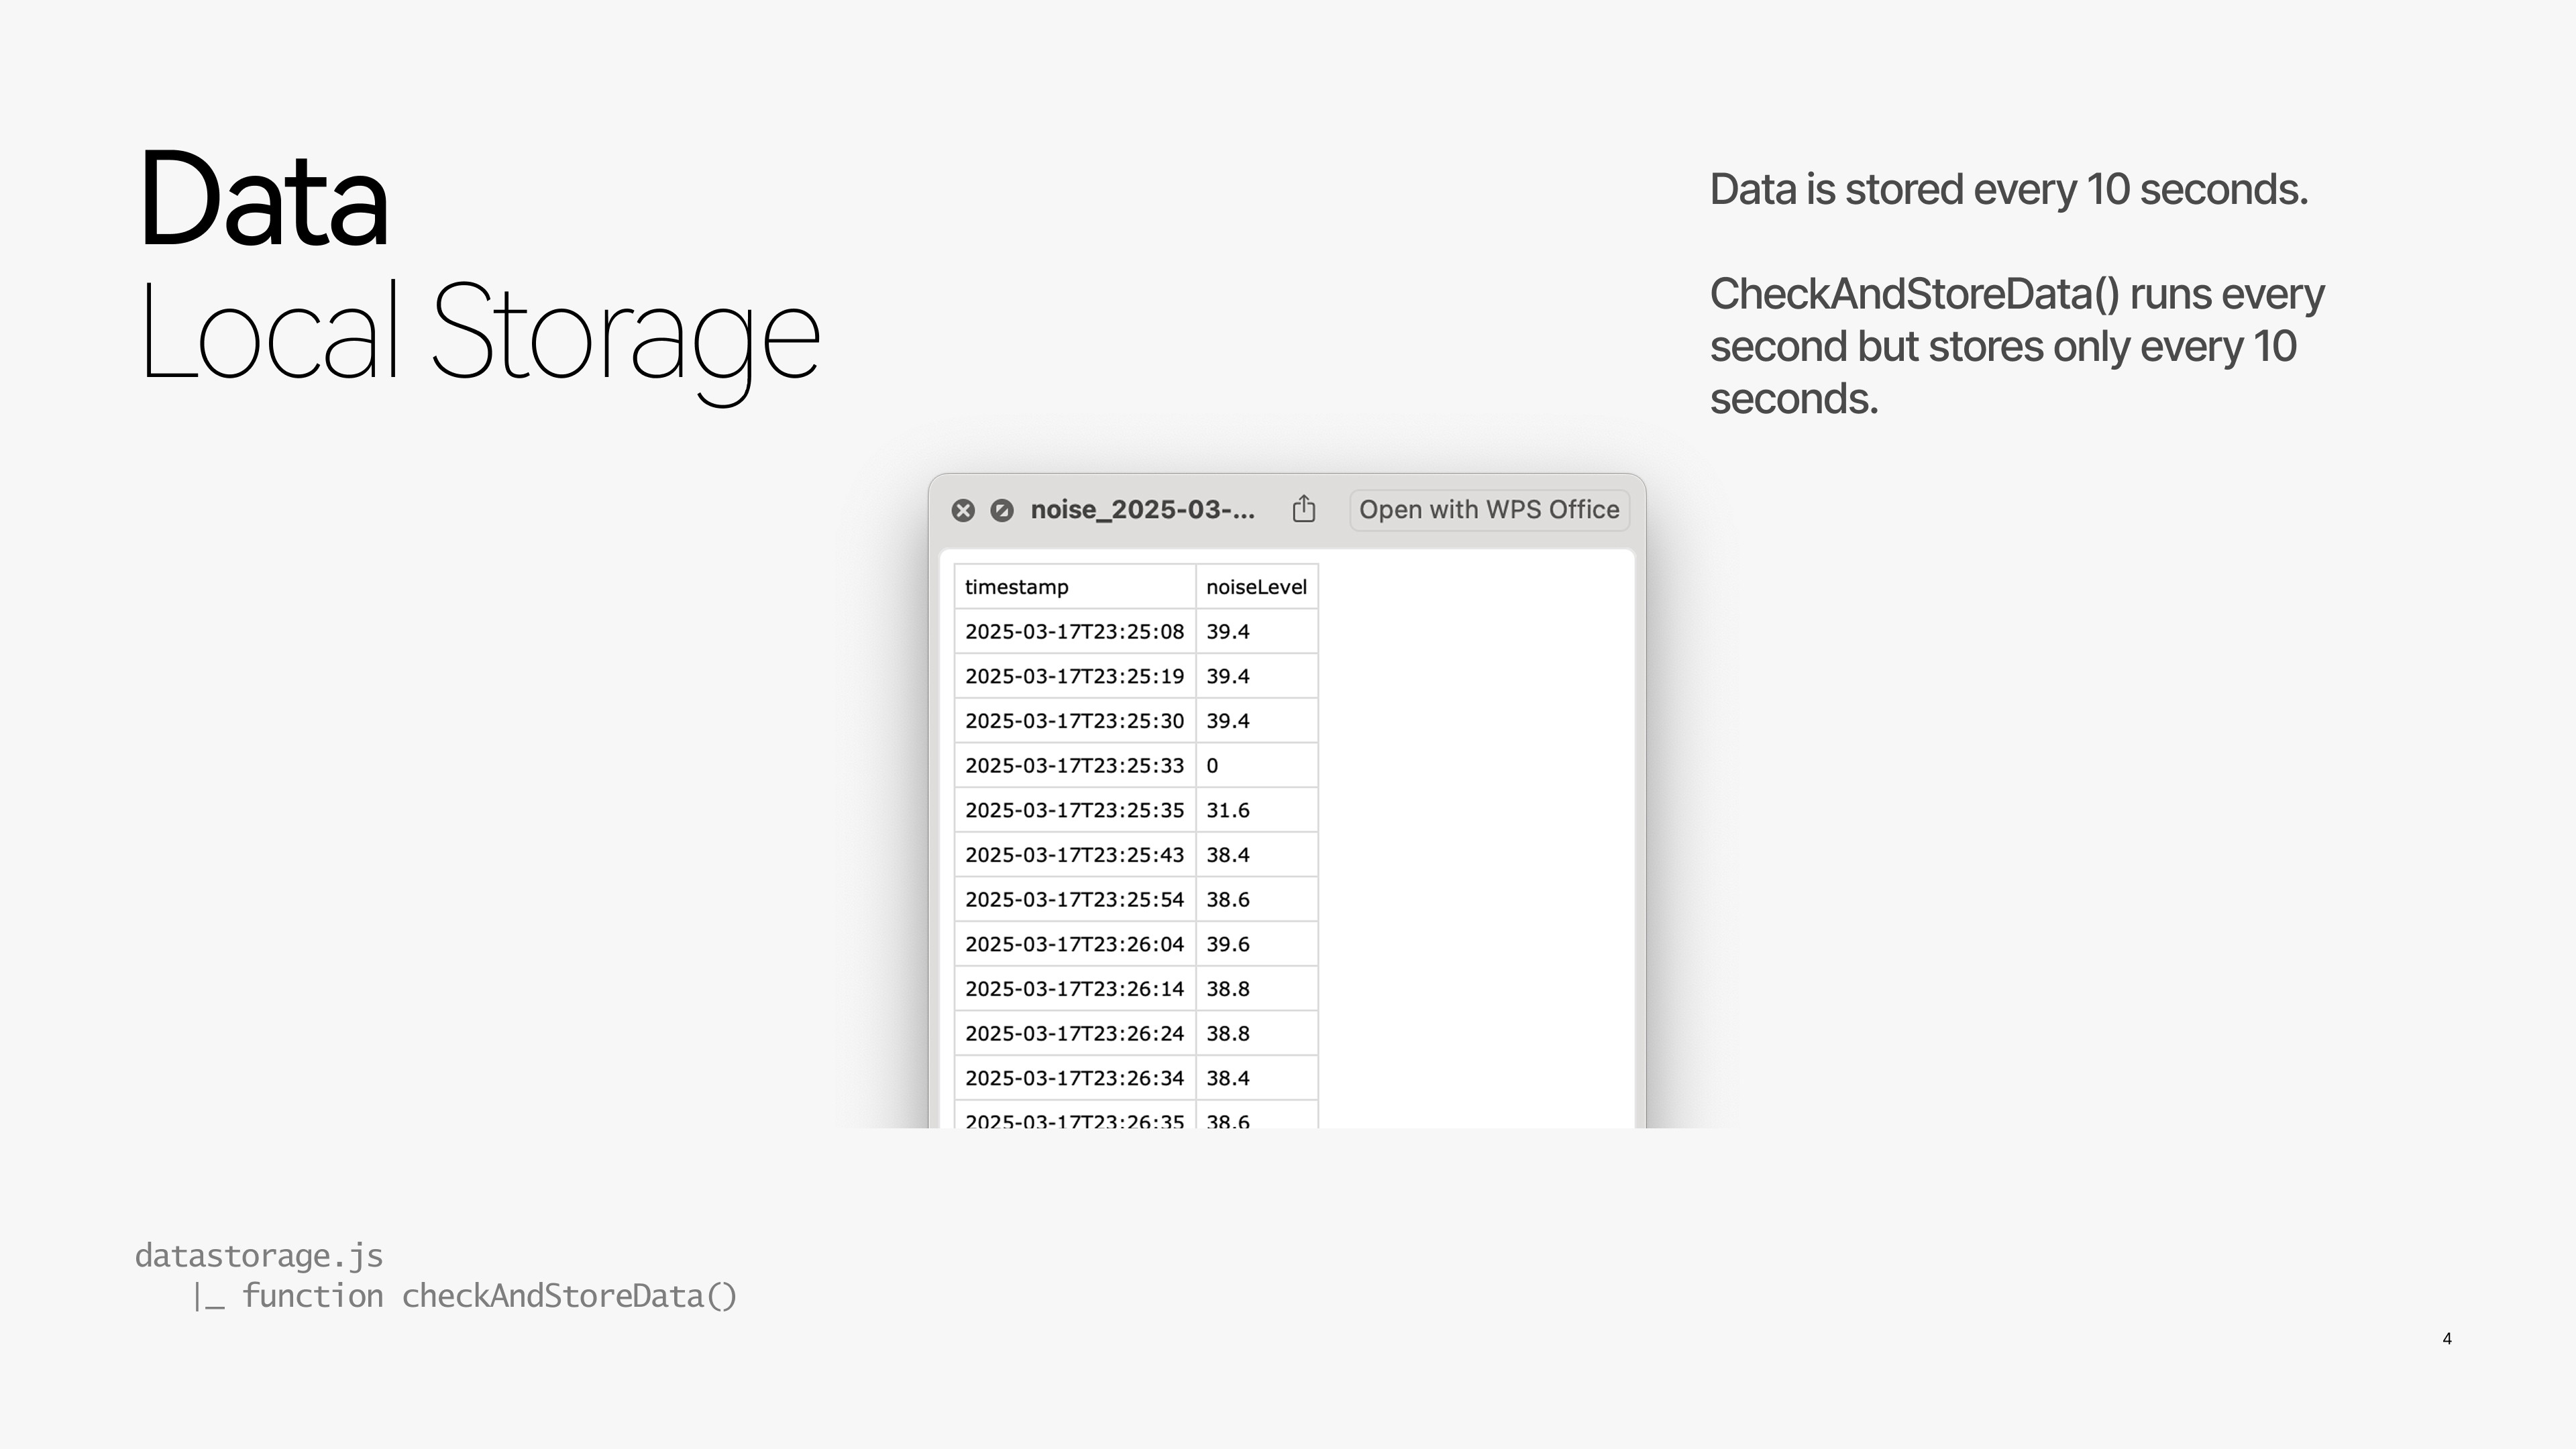
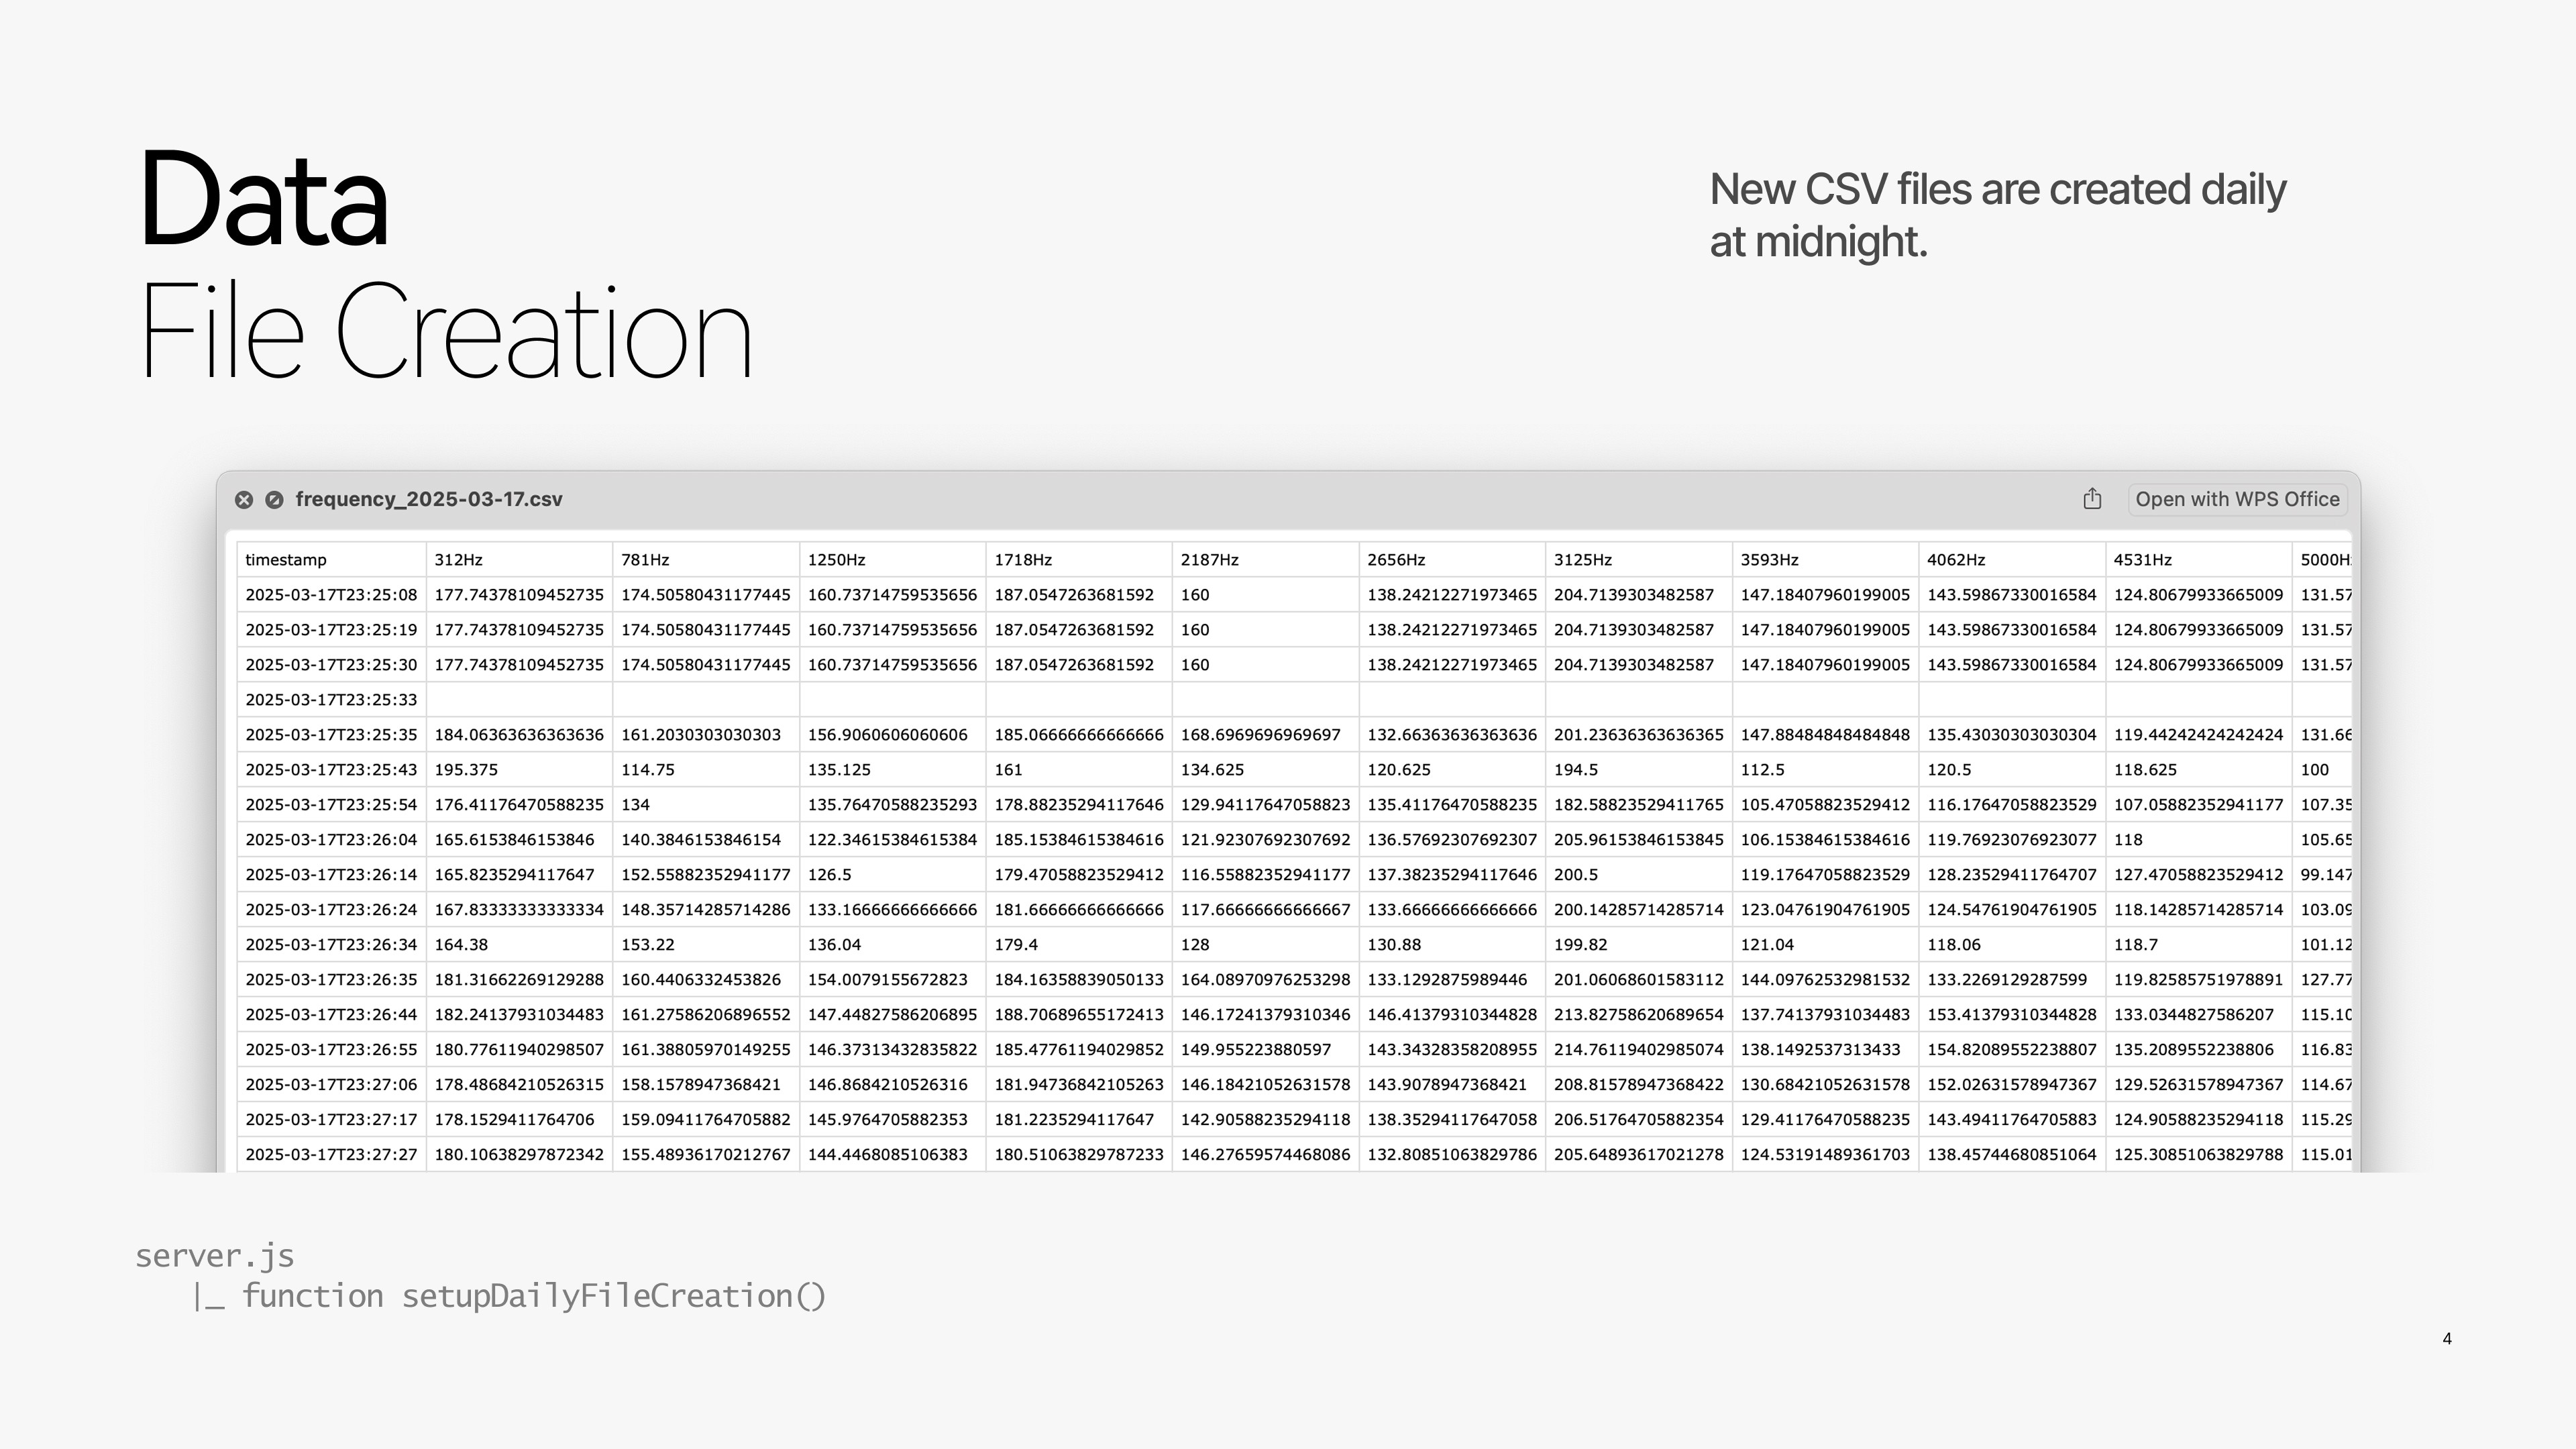
Data Persistence & System Robustness
Behind the interface, sensor data is periodically stored locally and organized into daily CSV files. This design supports historical analysis while keeping real-time interactions responsive. By decoupling sensing, visualization, and storage, the system remains stable even under network interruptions or resource constraints.